

Publication
Research Article
International Journal of MS Care
Vitamin D Levels and Visual System Measurements in Progressive Multiple Sclerosis
Abstract
Background:
Vitamin D deficiency is associated with increased disease activity in multiple sclerosis (MS), but its role in progressive MS has not been elucidated. The objective was to determine the correlation between vitamin D levels and visual parameters in primary progressive MS (PPMS) and secondary progressive MS (SPMS).
Methods:
Serum 25-hydroxyvitamin D (25[OH]D) and 25-hydroxyvitamin D3 (25[OH]D3) levels were obtained from the Secondary and Primary Progressive Ibudilast NeuroNEXT Trial in MS (SPRINT-MS). Visual function measurements and vitamin D associations were determined using the Pearson correlation and the generalized linear mixed model.
Results:
The analysis included 258 patients (mean ± SD age of 55.6 ± 7.3 years, 52.7% female, and 52.3% PPMS). Mean vitamin D values were above sufficiency and were similar between PPMS and SPMS (P = .47 and P = .31). There was no association between 25(OH)D3 levels and any visual markers, including peripapillary retinal nerve fiber layer thickness (Spearman r = −0.08), macular volume (r = −0.03), ganglion cell–inner plexiform layer (r = −0.07), and 2.5% low-contrast visual acuity test (r = −0.10). No statistically significant associations between vitamin D levels and visual system measurements were detected in the PPMS and SPMS subgroups.
Conclusions:
Vitamin D levels were not associated with optical coherence tomography findings or low-contrast letter acuity in this group of patients with progressive MS.
Several studies have demonstrated that insufficient levels of vitamin D are a risk factor for developing multiple sclerosis (MS) and that low levels of vitamin D are associated with worsening measurements of disease activity.1–3 Previous studies examining the role of vitamin D in MS focused on relapsing forms of the disease. Those observational studies have illustrated a reduced hazard of relapses4 and magnetic resonance imaging (MRI) metrics5 6 with vitamin D levels. A recent randomized vitamin D trial did not meet its primary end point but did show significantly lower MRI activity in the treatment group.7 Unfortunately, there is relatively little information in progressive MS. Available evidence suggests that patients with relapsing-remitting MS8 have higher vitamin D levels compared with progressive MS cohorts, and vitamin D deficiency may influence the conversion to secondary progressive MS (SPMS).9 Sufficient vitamin D levels have also been associated with improved visual health outside of MS. A meta-analysis of vitamin D and age-related macular degeneration showed that sufficient levels may be protective against age-related macular degeneration, especially in the late stages of the disease.10
Visual system dysfunction is a leading cause of disability in MS.11 Visual symptoms are commonly reported in patients with MS, and even those without a history of optic neuritis may have optic nerve pathology.12 Optical coherence tomography (OCT) can be used to investigate the visual system through measurement of the peripapillary retinal nerve fiber layer (RNFL) thickness and the ganglion cell–inner plexiform layer (GCIPL) thickness.13 Optical coherence tomography uses near-infrared light to measure ocular structures, offering a quick, reliable, and noninvasive ocular monitoring technique. It also provides a unique window into the MS disease process because OCT measurements correlate with global disease processes, such as brain atrophy and overall disability,14 15 including in progressive MS.16
The limited number of treatment options in progressive MS is challenging for patients and clinicians alike and highlights the need to investigate modifiable MS risk factors such as vitamin D levels. The significance of vitamin D in progressive MS regarding visual function and OCT findings remains unknown. The aim of this study was to investigate the relationship between visual performance and vitamin D levels in progressive MS. The study’s hypothesis is that OCT measurements, 2.5% low-contrast visual acuity test results, and visual functional system score would correlate with vitamin D levels.
Methods
Data were obtained from the screening visits of the NeuroNEXT 102/Secondary and Primary Progressive Ibudilast NeuroNEXT Trial in Multiple Sclerosis (SPRINT-MS). The SPRINT-MS study was a randomized, double-blind, placebo-controlled study to evaluate the safety, tolerability, and activity of ibudilast in patients with progressive MS.17 Participants were enrolled at 28 sites across the United States between November 2013 and June 2015. Banked screening blood samples were obtained for vitamin D analysis from participants who consented to biobanking and future research analysis on these samples. Only patients with complete clinical and OCT data along with available blood samples were included in this analysis. The clinical data included demographics, MS disease history, Expanded Disability Status Scale (EDSS) score (including the visual functional system score), and Multiple Sclerosis Functional Composite score. The latter includes the following four components: Timed 25-Foot Walk test (T25FW), Nine-Hole Peg Test (NHPT), Symbol Digit Modalities Test, and low-contrast visual acuity test (2.5% contrast). The SPRINT-MS trial was approved by the NeuroNEXT central institutional review board at Massachusetts General Hospital, and the secondary analysis in this paper was approved by the Cleveland Clinic institutional review board. All of the clinical data were collected at the baseline visit, before randomization and subsequent ibudilast administration. Some enrollees did not continue onto active treatment in SPRINT-MS but are included in this analysis.
Participants
The SPRINT-MS study included patients aged 21 to 65 years with a diagnosis of either primary progressive MS (PPMS) or SPMS according to International Panel Criteria.18 Concomitant treatment with glatiramer acetate or interferon beta (IFNβ-1a or IFNβ-1b) was allowed. Patients had to be able to walk 25 feet either with or without an assistive device (EDSS score ≤ 6.5) and have experienced clinical disease progression during the previous 2 years as documented by worsening values on the EDSS, T25FW, or NHPT. Patients with complete clinical and OCT data were selected for this analysis. Vitamin D supplementation and a history of optic neuritis were not available in the SPRINT-MS database.
OCT Assessments
Spectral domain OCT was performed using either the Cirrus (Carl Zeiss Meditec Inc) or the Spectralis (Heidelberg Engineering Inc) spectral domain instruments. Sites were required to perform OCT consistently using the same instrument for the duration of the study. Measurements from the acquired scans were obtained and verified through a digital OCT reading center with certified graders. The OCT values available in the baseline data set included peripapillary RNFL thickness, GCIPL thickness, and total macular volume. Only high-quality scans reaching a minimum signal strength of 6 were included in the analyses. Twenty sites (72%) used the Cirrus machines and the remainder used the Spectralis. Device variation was considered in all analyses. The GCIPL thickness measurements were available only from Cirrus devices due to availability of analysis packages at the time the study was designed. For OCT measurements, the model accounted for age and adjusted for within-patient, inter-eye differences.
MRI Measures
All the MRI studies were conducted using Trio or Skyra (Siemens Medical Solutions USA Inc) or GE (version 12x or higher; GE Healthcare) 3-T systems. To ensure consistent results with the remote sites, imaging physicists reviewed the protocols before enrollment along with monthly quality assurance assessments.19 Image acquisition included three-dimensional spoiled gradient-recalled echo and proton density–weighted and T2-weighted two-dimensional turbo/fast spin-echo. No contrast was administered during MRI. The MRI measures extracted for this study included T1/T2 lesion volume along with brain parenchymal fraction, as described previously.17 A more detailed description between MRI outcomes and vitamin D levels has already been described and published.20
Vitamin D Assessments
Serum 25-hydroxyvitamin D2 (25[OH]D2) and 25-hydroxyvitamin D3 (25[OH]D3) were measured from the screening samples of the SPRINT-MS study, which has been described previously.20 In summary, total serum 25-hydroxyvitamin D (25[OH]D) levels represented the sum of 25(OH) D2 and 25(OH)D3 levels.21 Although sufficient levels of 25(OH)D are not delineated, multiple sources suggest that 30 ng/mL is appropriate for the general population, and it was used as the cutoff value for 25(OH)D sufficiency in the present study.22 To explore response gradient, 25(OH)D3 levels were grouped into the following categories based on previous vitamin D research: less than 30 ng/mL, 30 to 39 ng/mL, 40 to 49 ng/mL, and 50 ng/mL or greater.23 Deseasonalized vitamin D values were used in the analysis, which accounted for geographic and seasonal variation of UV light, latitude of the study site, and the month that the serum sample was obtained.24
Statistical Methods
Patient demographic features, disease characteristics, and imaging findings are summarized descriptively using proportions, means, and median values (nonnormal or skewed distribution). The 25(OH)D and 25(OH)D3 levels were first compared between PPMS and SPMS cohorts using a t test. The potential differences across 25(OH)D3 groups (<30, 30–39, 40–49, and ≥50 ng/mL) were examined using a mixed model to account for potential unequal variance. To explore the 25(OH)D3 exposure response, a trend over the four groups was estimated from contrast statements in the model. The generalized linear mixed model (GLIMMIX model) was used to account for possible device variation in OCT parameters between the two devices (Cirrus and Spectralis). Due to the skewed distribution, log transformation of T25FW, T1/T2 volume, and inverse transformation of NHPT were used in the analyses. The P for trend of difference on categorical variables across 25(OH)D3 groups was evaluated using the Cochran-Armitage trend test.
Associations of vision outcomes (OCT findings, 2.5% low-contrast visual acuity test result, and visual functional system score) with a continuous form of 25(OH)D3 were examined using the Pearson correlation. For OCT parameters, device partial correlation coefficient was estimated. The associations within MS type were examined using same method.
All analyses were performed using SAS version 9.4 (SAS Institute Inc). All P values presented in the tables and figure are two-sided, and P < .05 is considered statistically significant.
Results
Demographics
Of the 331 patients enrolled in the SPRINT-MS study, 258 (78%) had stored serum, OCT data, and clinical records from the screening visit available for analysis (Table 1). The cohort was equally represented by patients with PPMS (52.3%) and SPMS (47.7%). Most patients were White (93.5%), ranging in age from 31.8 to 65.9 (mean, 55.6) years. Mean ± SD vitamin D levels across all patients were 43.6 ± 17.8 ng/mL for 25(OH)D and 40.7 ± 19.2 ng/mL for 25(OH)D3. Both mean 25(OH)D (43.8 vs 42.9 ng/mL) and 25(OH) D3 (40.7 vs 39.9 ng/mL) levels were similar between patients with PPMS and SPMS (P = .47 and P = .31, respectively).


Patient characteristics overall and by 25-hydroxyvitamin D3 category
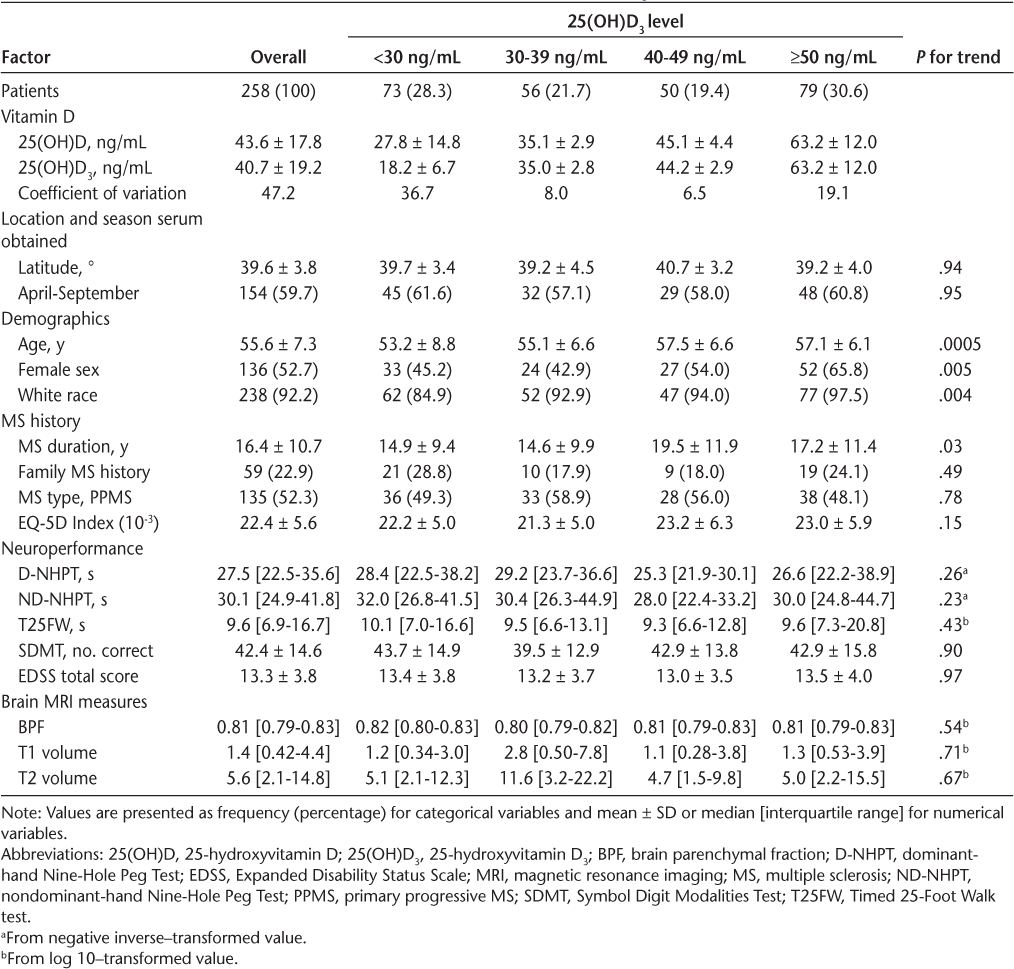
Vitamin D Dose Response on Clinical Outcomes
The subgroups of 25(OH)D3 (<30, 30–39, 40–49, and ≥50 ng/mL) and clinical/MRI outcomes are shown in Table 1. Older patients and those with a longer MS disease duration had higher 25(OH)D3 values. The EDSS scores were comparable in all 25(OH)D3 groups (P = .97). No differences were identified in MRI outcomes, including T1/T2 lesion volume and brain parenchymal fraction.
Vitamin D and Visual Outcomes in SPMS and PPMS
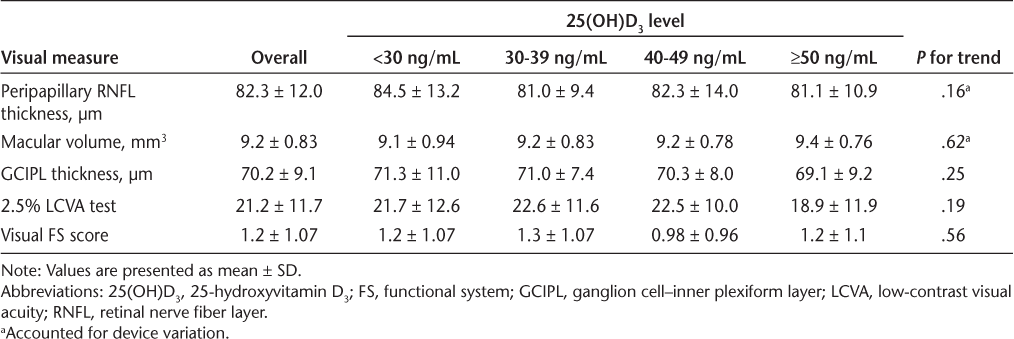
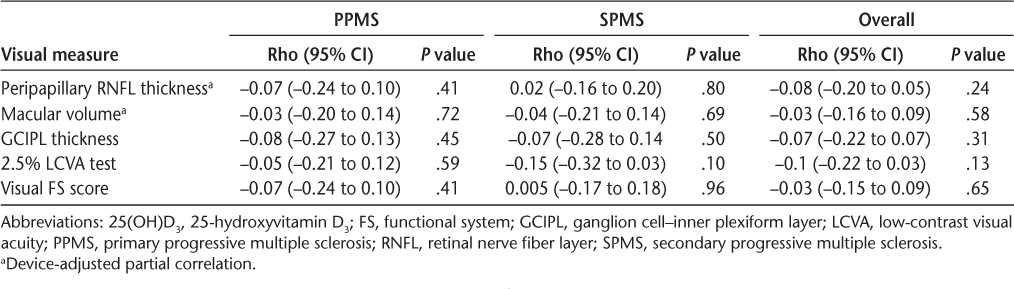
There was no association between 25(OH)D3, OCT findings, and other vision parameters, including low-contrast visual acuity test results and visual functional system score, even after accounting for device variation (Table 2 and Figure 1). Peripapillary RNFL thickness and other OCT findings were similar between dichotomized vitamin D levels within PPMS and SPMS, as were other visual measurements. When looking at different progressive MS courses separately, there were no associations between 25(OH)D3 levels and visual outcomes (Table 3). All Pearson correlation coefficient (r) values were less than 0.15.


Visual outcomes


Correlations between 25-hydroxyvitamin D3 (25[OH]D3) levels and visual parameters


Association of visual outcomes and 25(OH)D3
Discussion
This study investigated the association of vitamin D levels and visual markers in a progressive MS cohort. These results did not show an association between vitamin D levels and either OCT (peripapillary RNFL thickness, GCIPL thickness, and macular volume) or visual function measurements. These results are unexpected because vitamin D has been shown to correlate with disease activity in MS.1–3 Vitamin D is thought to modulate the immune system and downregulate proinflammatory markers.25 26 The lack of association in the present study could be because progressive MS is less driven by immune dysregulation. A retrospective analysis of a heterogeneous cohort of patients with MS identified that vitamin D levels correlated only with relapses in younger patients with MS, which supports the hypothesis that neurodegeneration and progression may be less related to vitamin D levels.27
Another potential explanation for the present results is that the relationship between vitamin D levels and optic nerve pathology is mediated more by active inflammation and, therefore, is less common in progressive forms of MS.28 For example, a prospective cohort study of patients with optic neuritis showed that vitamin D deficiency correlated with a greater propensity for inflammation and optic nerve injury and greater peripapillary RNFL thinning.29 This was confirmed in another study that showed an association between vitamin D levels and optic neuritis severity, but not altering long-term visual recovery at 1 year.30 A placebo-controlled, randomized clinical trial with 50,000 IU of vitamin D did not show an effect on RNFL thickness or macular volume.31 Other randomized controlled trials with vitamin D supplementation found mixed results.32–34
Recent evidence has suggested that GCIPL thickness and macular volume may be more sensitive markers for visual deterioration,35 36 and a prospective optic neuritis study showed a twofold difference in GCIPL thickness in vitamin D–sufficient versus vitamin D–insufficient patients.29 Because GCIPL values are less affected by optic disc inflammation and swelling, it may be a better marker for neuronal degeneration.37 Despite this evidence, the present study did not demonstrate an association with GCIPL or RNFL thickness.
Overall, the 25(OH)D values were similar in the PPMS and SPMS subpopulations. In addition, most of the participants had 25(OH)D values above sufficiency, which differs from previous studies in progressive MS.8 9 Contemporary patients with MS are likely to be taking vitamin D supplements given awareness about vitamin D in patients with MS. For example, a study published in 2019 showed vitamin D levels slightly above sufficiency in a heterogenous MS population, with 80% of their patients taking vitamin D supplements at the end of the study period.38 Vitamin D supplementation information was not collected in the SPRINT-MS study, which limits our ability to explore the potential confounding of vitamin D supplementation.
This study has several important limitations. A cross-sectional study of vitamin D levels in patients with progressive MS introduces some intrinsic biases into the analysis. There were no methods to capture UV exposure or other lifestyle factors, such as smoking or exercise, and these could not be incorporated into the article. The lack of longitudinal vitamin D levels is also an important limitation. Additional information, such as history of optic neuritis, ocular symptoms, and visual field testing, none of which are available in the SPRINT-MS data set, would be useful to interpret the present findings. To truly understand the role of vitamin D in progressive MS would require a longitudinal prospective study.
In conclusion, the findings from this study suggest that single, cross-sectional vitamin D levels are not related to retinal or visual measurements of chronic disease burden in this group of patients with progressive forms of MS. It is possible that long-term vitamin D exposure and other disease factors cloud the complex relationship of visual function and vitamin D in progressive MS. Prospective longitudinal studies examining vitamin D in progressive MS are needed.
PRACTICE POINTS
Insufficient levels of vitamin D are a risk factor for developing MS and are associated with worsening measurements of disease activity.
In this cross-sectional analysis there was no association between vitamin D levels and visual function in a progressive MS cohort.
Financial Disclosures
Dr Fox receives consulting fees from Actelion, Biogen, Celgene, EMD Serono, Genentech, Immunic, Novartis, and Teva; serves on advisory committees for Actelion, Biogen, Immunic, and Novartis; and has received clinical trial contract and research grant funding from Biogen and Novartis. Dr Bermel is a consultant for Biogen, Genzyme, Genentech, and Novartis; receives research support from Biogen, Genentech, and Novartis; and shares rights to intellectual property underlying the Multiple Sclerosis Performance Test, currently licensed to Qr8 Health and Biogen. Dr Ontaneda has received grant support from Genzyme, Genentech, and Novartis and consulting fees from Biogen, Genzyme, and Genentech. The other authors declare no conflicts of interest.
References
Mowry EM, Waubant E, McCulloch CE, . Vitamin D status predicts new brain magnetic resonance imaging activity in multiple sclerosis. Ann Neurol. 2012; 72: 234– 240.
Soilu-Hanninen M, Aivo J, Lindstrom BM, . A randomised, double blind, placebo controlled trial with vitamin D3 as an add on treatment to interferon beta-1b in patients with multiple sclerosis. J Neurol Neurosurg Psychiatry. 2012; 83: 565– 571.
Munger KL, Levin LI, Hollis BW, Howard NS, Ascherio A. Serum 25-hydroxyvitamin D levels and risk of multiple sclerosis. JAMA. 2006; 296: 2832– 2838.
Simpson S Jr, Taylor B, Blizzard L, . Higher 25-hydroxyvitamin D is associated with lower relapse risk in multiple sclerosis. Ann Neurol. 2010; 68: 193– 203.
Rotstein DL, Healy BC, Malik MT, . Effect of vitamin D on MS activity by disease-modifying therapy class. Neurol Neuroimmunol Neuroinflamm. 2015; 2: e167.
Fitzgerald KC, Munger KL, Kochert K, . Association of vitamin D levels with multiple sclerosis activity and progression in patients receiving interferon beta-1b. JAMA Neurol. 2015; 72: 1458– 1465.
Hupperts R, Smolders J, Vieth R, . Randomized trial of daily high-dose vitamin D3 in patients with RRMS receiving subcutaneous interferon beta-1a. Neurology. 2019; 93: e1906– e1916.
Smolders J, Menheere P, Kessels A, Damoiseaux J, Hupperts R. Association of vitamin D metabolite levels with relapse rate and disability in multiple sclerosis. Mult Scler. 2008; 14: 1220– 1224.
Muris AH, Rolf L, Broen K, Hupperts R, Damoiseaux J, Smolders J. A low vitamin D status at diagnosis is associated with an early conversion to secondary progressive multiple sclerosis. J Steroid Biochem Mol Biol. 2016; 164: 254– 257.
Annweiler C, Drouet M, Duval GT, . Circulating vitamin D concentration and age-related macular degeneration: systematic review and meta-analysis. Maturitas. 2016; 88: 101– 112.
McDonald WI, Barnes D. The ocular manifestations of multiple sclerosis, 1: abnormalities of the afferent visual system. J Neurol Neurosurg Psychiatry. 1992; 55: 747– 752.
Fjeldstad C, Bemben M, Pardo G. Reduced retinal nerve fiber layer and macular thickness in patients with multiple sclerosis with no history of optic neuritis identified by the use of spectral domain high-definition optical coherence tomography. J Clin Neurosci. 2011; 18: 1469– 1472.
Xu SC, Kardon RH, Leavitt JA, Flanagan EP, Pittock SJ, Chen JJ. Optical coherence tomography is highly sensitive in detecting prior optic neuritis. Neurology. 2019; 92: e527– e535.
Gordon-Lipkin E, Chodkowski B, Reich DS, . Retinal nerve fiber layer is associated with brain atrophy in multiple sclerosis. Neurology. 2007; 69: 1603– 1609.
Abalo-Lojo JM, Limeres CC, Gomez MA, . Retinal nerve fiber layer thickness, brain atrophy, and disability in multiple sclerosis patients. J Neuroophthalmol. 2014; 34: 23– 28.
Petracca M, Cordano C, Cellerino M, . Retinal degeneration in primary-progressive multiple sclerosis: a role for cortical lesions? Mult Scler. 2017; 23: 43– 50.
Fox RJ, Coffey CS, Cudkowicz ME, . Design, rationale, and baseline characteristics of the randomized double-blind phase II clinical trial of ibudilast in progressive multiple sclerosis. Contemp Clin Trials. 2016; 50: 166– 177.
Polman CH, Reingold SC, Banwell B, . Diagnostic criteria for multiple sclerosis: 2010 revisions to the McDonald criteria. Ann Neurol. 2011; 69: 292– 302.
Zhou X, Sakaie KE, Debbins JP, . Quantitative quality assurance in a multicenter HARDI clinical trial at 3T. Magn Reson Imaging. 2017; 35: 81– 90.
Abbatemarco JR, Fox RJ, Li H, Ontaneda D. Vitamin D and MRI measures in progressive multiple sclerosis. Mult Scler Relat Disord. 2019; 35: 276– 282.
Logan VF, Gray AR, Peddie MC, Harper MJ, Houghton LA. Long-term vitamin D3 supplementation is more effective than vitamin D2 in maintaining serum 25-hydroxyvitamin D status over the winter months. Br J Nutr. 2013; 109: 1082– 1088.
Dawson-Hughes B, Heaney RP, Holick MF, Lips P, Meunier PJ, Vieth R. Estimates of optimal vitamin D status. Osteoporos Int. 2005; 16: 713– 716.
Park SK, Garland CF, Gorham ED, BuDoff L, Barrett-Connor E. Plasma 25-hydroxyvitamin D concentration and risk of type 2 diabetes and pre-diabetes: 12-year cohort study. PLoS One. 2018; 13: e0193070.
van der Mei IA, Ponsonby AL, Dwyer T, . Vitamin D levels in people with multiple sclerosis and community controls in Tasmania, Australia. J Neurol. 2007; 254: 581– 590.
Ascherio A, Munger KL, Simon KC. Vitamin D and multiple sclerosis. Lancet Neurol. 2010; 9: 599– 612.
Nataf S, Garcion E, Darcy F, Chabannes D, Muller JY, Brachet P. 1,25 Dihydroxyvitamin D3 exerts regional effects in the central nervous system during experimental allergic encephalomyelitis. J Neuropathol Exp Neurol. 1996; 55: 904– 914.
Muris AH, Smolders J, Rolf L, . Vitamin D status does not affect disability progression of patients with multiple sclerosis over three year follow-up. PLoS One. 2016; 11: e0156122.
Henderson AP, Trip SA, Schlottmann PG, . A preliminary longitudinal study of the retinal nerve fiber layer in progressive multiple sclerosis. J Neurol. 2010; 257: 1083– 1091.
Burton JM, Eliasziw M, Trufyn J, Tung C, Carter G, Costello F. A prospective cohort study of vitamin D in optic neuritis recovery. Mult Scler. 2017; 23: 82– 93.
Malik MT, Healy BC, Benson LA, . Factors associated with recovery from acute optic neuritis in patients with multiple sclerosis. Neurology. 2014; 82: 2173– 2179.
Salari M, Janghorbani M, Etemadifar M, Dehghani A, Razmjoo H, Naderian G. Effects of vitamin D on retinal nerve fiber layer in vitamin D deficient patients with optic neuritis: preliminary findings of a randomized, placebo-controlled trial. J Res Med Sci. 2015; 20: 372– 378.
Burton JM, Kimball S, Vieth R, . A phase I/II dose-escalation trial of vitamin D3 and calcium in multiple sclerosis. Neurology. 2010; 74: 1852– 1859.
Mosayebi G, Ghazavi A, Ghasami K, Jand Y, Kokhaei P. Therapeutic effect of vitamin D3 in multiple sclerosis patients. Immunol Invest. 2011; 40: 627– 639.
Kampman MT, Steffensen LH, Mellgren SI, Jorgensen L. Effect of vitamin D3 supplementation on relapses, disease progression, and measures of function in persons with multiple sclerosis: exploratory outcomes from a double-blind randomised controlled trial. Mult Scler. 2012; 18: 1144– 1151.
Saidha S, Syc SB, Durbin MK, . Visual dysfunction in multiple sclerosis correlates better with optical coherence tomography derived estimates of macular ganglion cell layer thickness than peripapillary retinal nerve fiber layer thickness. Mult Scler. 2011; 17: 1449– 1463.
Burkholder BM, Osborne B, Loguidice MJ, . Macular volume determined by optical coherence tomography as a measure of neuronal loss in multiple sclerosis. Arch Neurol. 2009; 66: 1366– 1372.
Syc SB, Saidha S, Newsome SD, . Optical coherence tomography segmentation reveals ganglion cell layer pathology after optic neuritis. Brain. 2012; 135( pt 2): 521– 533.
Linden J, Granasen G, Salzer J, Svenningsson A, Sundstrom P. Inflammatory activity and vitamin D levels in an MS population treated with rituximab. Mult Scler J Exp Transl Clin. 2019; 5: 2055217319826598.