
Publication
Research Article
International Journal of MS Care
Women's and Men's Differing Experiences of Health, Lifestyle, and Aging with Multiple Sclerosis
Background:
The growing population of older people with multiple sclerosis (MS) has led to more interest in understanding factors associated with healthy aging. We aimed to determine whether older women and men with MS have different health and lifestyle behaviors and whether there are sex differences in contributors to perceived health.
Methods:
Data were obtained from a postal survey involving 743 Canadians older than 55 years with MS for at least 20 years. Sex differences in health, lifestyle, mood, and socioeconomics were examined using analysis of variance. Multiple regression was used to build explanatory models of health perception.
Results:
Despite no differences in age, years with MS, disability, fatigue, or social support, older men (n = 166) experienced lower perceived health and lower resilience and participated less in life roles than older women (n = 577). Men experienced more depressive symptoms, and women reported more anxiety. Depression was the strongest predictor of health perception in both women and men (β = −2.40 and −5.19, respectively, for each 3-point increase in depressive symptoms). Other contributors included household participation, fatigue, resilience, and disability in women and physical activity, financial flexibility, and alcohol use in men.
Conclusions:
Older men exhibit poorer adaptation to aging with MS than older women.
People with multiple sclerosis (MS) not only report lower health-related quality of life (HRQOL) compared with others without MS1 2 but also have lower HRQOL than people with other chronic conditions, such as inflammatory bowel disease and rheumatoid arthritis.3 Perception of health and HRQOL have important implications in MS, as people reporting lower HRQOL are at greater risk for future progression of disability.4
During the past 2 decades there has been a shift toward improved longevity in people with MS.5 The growing population of older people with MS has led to more interest in understanding factors associated with healthy aging, a concept linked to health perception and HRQOL. The Wilson-Cleary (W-C) model6 proposes that the perception of health is influenced by functional status (disability and participation), which in turn is driven by disease-related biology and symptoms. However, the model of health perception is not entirely linear, as both personal characteristics (eg, motivation and personality) and environmental characteristics (eg, socioeconomic status and social supports) can modify the direct causative factors. The W-C model has been useful in understanding factors that influence participation and health perception in people with stroke7 and MS.8 It is evident from this research that the concepts of HRQOL, health perception, and healthy aging likely overlap.
Ploughman and colleagues,9 using qualitative methods, described interconnected factors that influenced healthy aging with MS. These factors included resilience, mental health, financial flexibility, social support, independence, and others. Although not in older cohorts, other researchers have found that factors such as depression, disability, decreased levels of social support, and unemployment predicted HRQOL in MS,10 11 whereas fatigue and MS-related symptoms (measured using the Expanded Disability Status Scale) predicted HRQOL in people with secondary progressive MS.12 Whether these factors explain health perception/HRQOL (or healthy/successful aging) in older groups is not known.
Considering the sex differences in MS occurrence,13 it would be reasonable to think that there are differences in health, lifestyle, health perception, and aging between women and men. Upton and Taylor14 suggested that in terms of requirements for support, men have different needs and have a different experience of living with MS than do women. Only two studies have examined sex differences in HRQOL, both examining young to middle-aged (aged 18–60 years) cohorts of patients with MS.1 15 Both studies reported that men had a stronger association between disability and HRQOL than women. To our knowledge, no studies have examined sex differences in health perception specifically in older people with MS.
We aimed to determine whether older women and men with MS have different health and lifestyle behaviors and whether there were sex differences in contributors to perceived health. Lifestyle and health perception are important targets for health interventions, and, as suggested by other researchers, providing health-care advice tailored to individuals' circumstances will likely result in better outcomes.16
Methods
Design and Population
The data came from the Canadian Survey of Health, Lifestyle, and Aging with MS, which was a cross-sectional study involving Canadians who were older than 55 years and had MS for at least 20 years.17 Ethical approval was obtained from 11 health research ethics boards in eight Canadian provinces. Participants were recruited through MS clinics, MS Society of Canada chapters, and newspapers. The complete methods have been reported elsewhere.17 Of the 921 people contacted, 743 (81%; aged 55–88 years) returned the mailed questionnaire; 577 were women and 166 were men.17
Measurement Strategy
The measurement strategy, based on the W-C model,6 used a mix of standardized measures of biological factors, symptoms, function (disability and participation), and individual and environmental factors as well as custom-designed indicators of MS experiences (employment, fatigue, perceived health, and satisfaction with health services). These latter indicators were developed based on qualitative research.9 18 19 The outcome variable was general health perception measured using a 100-mm visual analogue scale (VAS) ranging from worst possible health state to best possible health state.
Contributing Variables
The contributing variables were chosen from previous research9 19 and covered most domains of the W-C model.
Biological and Physiological Factors
The variables under this domain of the W-C model included age, the type of MS participants were initially diagnosed as having, years since MS diagnosis, use of disease-modifying drugs, and comorbid conditions. Comorbid conditions, captured using the Comorbidity Questionnaire,20 were further divided into three categories: cardiovascular, mental illness, and musculoskeletal.
Symptoms
Mood-related factors of depression, anxiety, fatigue, and stress were measured. The two components of the Hospital Anxiety and Depression Scale (HADS) each contained seven items scored on a scale from 0 to 21, with higher scores indicating more symptoms.21 Current level of fatigue was measured using a 100-mm VAS, and stress was measured using the subscale of the Simple Lifestyles Indicator Questionnaire, an ordinal scale ranging from 1 (low stress) to 6 (high stress).22
Disability and Participation
The variables under this domain included independence in activities of daily living and participation in life roles. The Barthel Index measured independence in activities of daily living such as feeding, bathing, bladder and bowel control, ambulation, and stair climbing. Scores ranged from 0 to 100, with higher scores indicating more independence.23 Role participation was measured using the Frenchay Activities Index. Subsection scores (household, leisure, and out-of-home activities) ranged from 5 to 20, with higher scores indicating more frequent participation.24 Household activities included meal preparation, household/car maintenance, and housework-related tasks; leisure activities included hobbies and reading; and out-of-home activities included driving, shopping, and social events.
Individual Characteristics
This domain of the W-C model included two subsections: lifestyle factors and resilience. Lifestyle-related factors included physical activity, diet, alcohol use, and smoking captured in the Simple Lifestyles Indicator Questionnaire.22 Physical activity and diet scores ranged from 0 to 24 and 0 to 15, respectively, with higher scores suggesting a healthier lifestyle. Alcohol use was counted as the number of drinks per week, and smoking was categorized as nonsmoker or current smoker. The Resilience Scale comprised 12 items with scores ranging from 1 to 7, with higher scores indicating higher levels of resilience.25
Environmental Characteristics
This domain included socioeconomic status, education, and social/health support. Specifically, participants were asked whether they had sufficient financial resources to meet their needs, their current employment status, whether they lived alone, whether they were receiving paid or unpaid personal support at home, and whether they stopped working or retired due to MS. Participants provided their years of education. We measured social support using the Personal Resources Questionnaire-2000, which uses statements with which participants agree or disagree, such as “I belong to a group in which I feel important,” on a 7-point Likert scale ranging from a low of 15 to a high of 105.26 The helpfulness of the health-care team was determined by a custom-designed question in which respondents listed their MS-related health professionals and then provided ratings of each team member's helpfulness on a scale from 1 (not at all helpful) to 5 (extremely helpful). The score was calculated by multiplying the number of health-care professionals by the helpfulness rating.
Data Analysis
Sex differences in health and lifestyle variables were examined using analysis of variance for continuous variables and the χ2 test for categorical variables.
To develop a model that explained perceived health in men and women with MS, we performed the analysis in three stages according to previously published methods.27 In stage 1, we plotted the distribution of the dependent (explanatory) variables. If the explanatory variable was not normally distributed (skewed), it was recoded into a categorical variable (binary or quartiles). Categorical variables were analyzed to ensure that they were represented linearly, and if not, we recoded them to best model a linear variable. Sex-specific analyses were performed using univariate linear regression with each explanatory variable regressed on the outcome of health perception. We maintained either the natural or recoded variable based on whichever had the higher r 2 value from the simple linear regression output.
In the next stage, all significant predictors (P < .1) moved to the blocked stepwise regression step. The explanatory variables were grouped together based on the W-C model domains or domain subsections. They were entered into stepwise regression in blocks (maintaining these groups) from highest to lowest r 2 value. Those explanatory variables that explained unique variance of the outcome from each category advanced to the final stage. In this stage, we aimed to minimize the number of predictors of perceived health. The model fit was examined by the model R and r 2 value and casewise diagnostics. Casewise diagnostics indicate whether there are outliers that do not fit the model (outside 3 standard deviations). At this step, correlations between explanatory variables were also analyzed. Variables correlated greater than 0.4 (Pearson correlation) were identified, removed, and reentered into the model to determine their unique contribution to the model until best fit was achieved.
We determined correlation of residuals by calculating the Durbin-Watson statistic (value around 2) and multicollinearity by examining tolerance (>0.1) and the variance inflation factor (<10). Once we created the final explanatory models for women and men, we then used two methods to determine whether the models predicting perceived health were different between the sexes: 1) cross-validation, in which we tested the model fit for one sex against the other, and 2) fitting an interaction term (sex × predictor). Data were analyzed using a statistical software program (IBM SPSS Statistics for Windows, version 21.0; IBM Corp, Armonk, NY).
Results
There were no differences in disability (Barthel Index) between men and women in this sample of older people with MS (Table 1). They also did not differ in age, years of education, and years since MS diagnosis. However, there were some important differences in their experiences of aging with MS. Despite having no differences in disability, being less likely to live alone, and having fewer musculoskeletal comorbid conditions, men perceived their health to be lower (mean ± SD: 51.31 ± 25.42) on the VAS than did women (mean ± SD: 56.04 ± 23.68, P < .05) (Table 1) and reported lower mean ± SD levels of resilience (75.96 ± 13.95 vs. 78.28 ± 13.12, P < .05) (Table 1). Women had higher mean ± SD HADS anxiety scores (6.35 ± 3.86 vs. 5.33 ± 3.66, P < .01), whereas men had higher mean ± SD HADS depression scores (6.49 ± 3.98 vs. 5.68 ± 3.44, P < .05) (Table 1). Although relapsing-remitting MS was the most common initial diagnosis in both sexes, men were more likely to be diagnosed as having progressive MS (37.35% vs. 20.45%, P < .001) (Table 1).


Sex differences in health and lifestyle behaviors in older people with MS
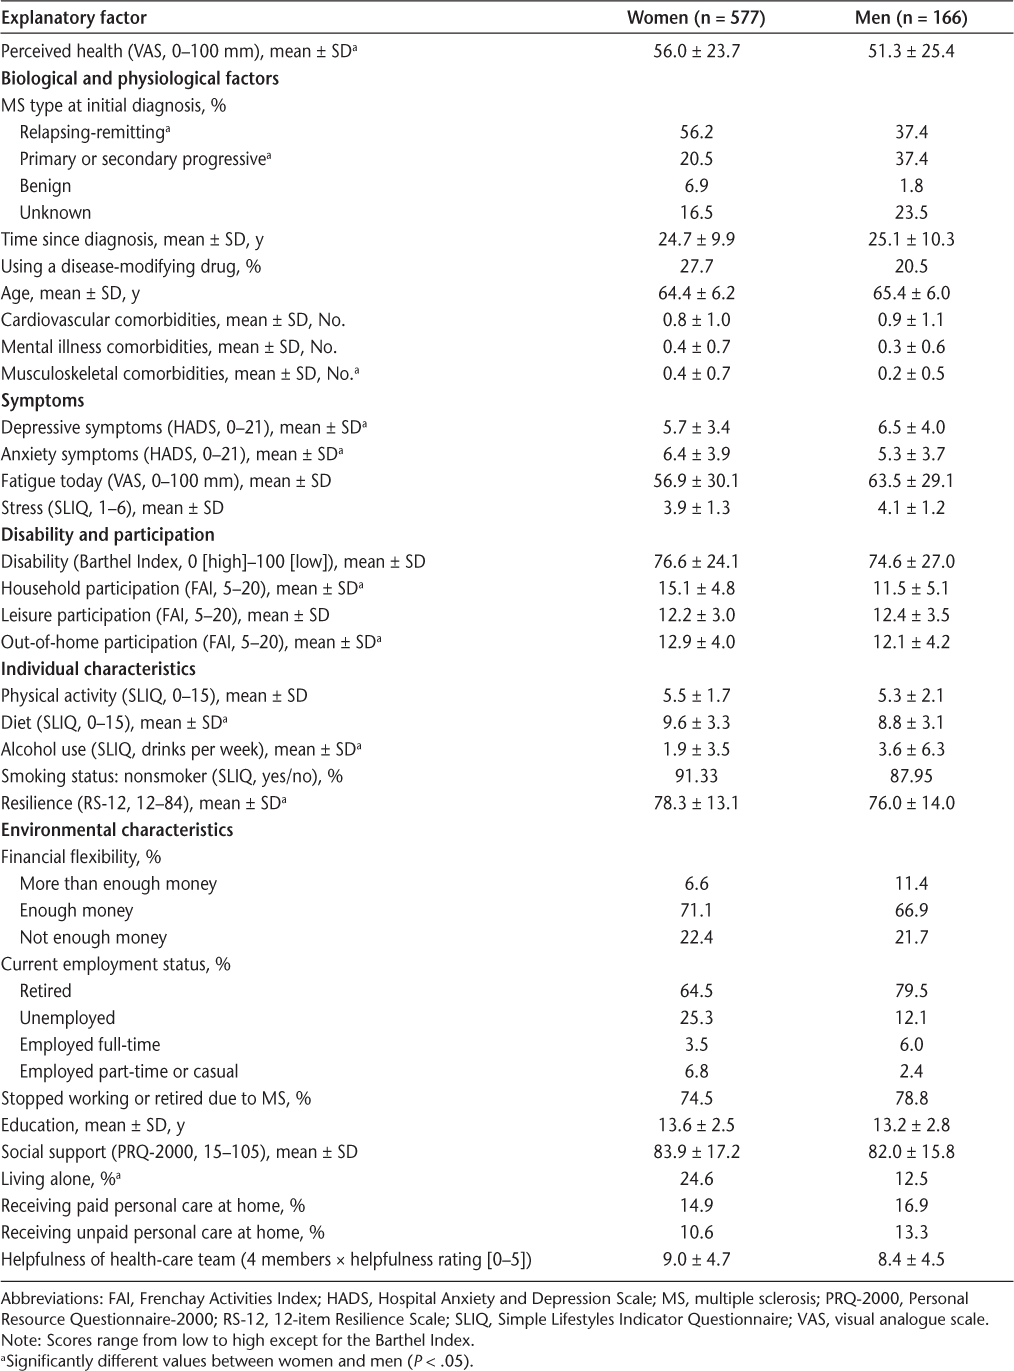
In terms of health and lifestyle behaviors, women reported more participation in household and out-of-home roles than men (Table 1). Women reported higher adherence to a healthy diet (high in fruits and vegetables and lower in meat); however, men consumed more alcoholic drinks per week (mean ± SD: 3.63 ± 6.28 vs. 1.92 ± 3.47, P < .001) (Table 1).
Predictors of Health Are Different Between Older Women and Men with MS
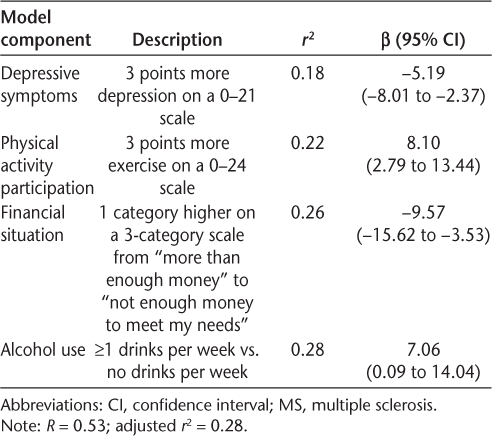
In both sexes, the presence of depressive symptoms was the strongest predictor of perceived health (women: R = 0.34, men: R = 0.42); however, the impact was greater in men (Tables 2 and 3). Every 3-point increase in depressive symptoms (scale, 0–21) was associated with a 5.2-point decrease in health perception in men but only a 2.4-point decrease in women. Depressive symptoms, physical activity, financial flexibility, and alcohol consumption (one or more drinks per week vs. abstinence) were unique predictors of perceived health in older men with MS (Table 3). For every 3-point increase in physical activity participation, men had an 8.1-point increase in perceived health. For every one-category drop in financial flexibility, men reported a 9.6-point drop in health perception, and men drinking one or more drinks per week had a 7-point increase in health perception compared with those reporting abstaining from alcohol.


Final explanatory model of perceived health in older women with MS


Final explanatory model of perceived health in older men with MS
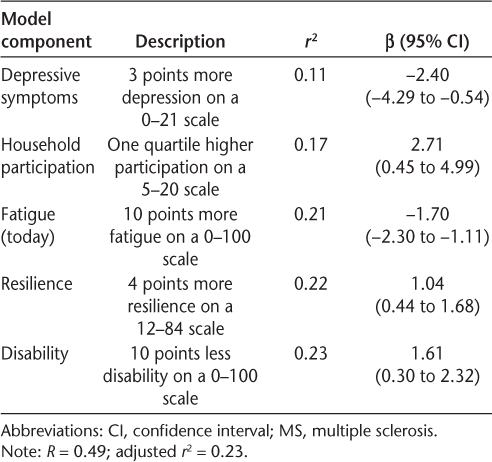
In addition to depressive symptoms, participation in household activities, present level of fatigue, resilience, and level of disability were unique predictors of perceived health in women (Table 2). Women reporting a one-quartile higher level of household participation had a 2.7-point increase in perceived health. Ten more points on a 100-mm scale of fatigue was associated with a 1.7-point drop in health, and 4 points higher of reported resilience was associated with a 1-point improvement in health. For every 10 points less of disability on a 0 to 100 scale, women experienced a 1.6-point improvement in perceived health.
The final explanatory models of health perception accounted for 23% of the variance in older women (R = 0.49, P < .0001) (Table 2) and 28% of the variance in older men (R = 0.53, P < .0001) (Table 3). When examining casewise diagnostics, there were no male outliers and only one female outlier, suggesting a good model fit. The models for women and men had low correlation of residuals (Durbin-Watson statistic, 1.96 and 2.17, respectively) and acceptable levels of multicollinearity (tolerances, 0.49 and 0.95; variance inflation factors, 2.06 and 1.06, respectively).
To determine an interaction effect of sex on the explanatory variables, we fitted an interaction term for each predictor. We found that only the interaction of alcohol consumption and sex was significantly associated with perceived health (P = .05). To test the degree of difference in the sex models further, we applied the predictors of perceived health in men to the sample of women. The predictive value of the model for women dropped from 23% to 14%, with no change in casewise diagnostics. Completing the same manipulation in the sample of men, the predictive value for men dropped from 27% to 21%, with one more male not accounted for by the model. These findings suggest that there is overlap in predictors of perceived health for older men and women with MS, with the exception of alcohol consumption, which is predictive in men only.
Discussion
We show, for the first time, evidence that despite similarities in age, years with MS, level of disability, and social support, older men exhibit poorer adaptation to aging with MS than older women. We used a large, unique, and rich data set in which the variables were included based on factors deemed important by older people with MS themselves.9 19 Older men with MS reported lower levels of resilience, more depressive symptoms, poorer diet habits, less participation in household activities (such as housework and home/car maintenance) and out-of-home activities (such as social events and driving), and poorer perceived health than older women. Although Asano and colleagues28 reported that women with MS had higher scores compared with men on the 100-mm EuroQol VAS, the average age of the 417 participants was 43 years. The present work confirms that older people with MS have similar sex differences in perceived health as has been observed in older people living with other chronic diseases. For example, in elderly people with chronic diseases such as arthritis, heart disease, hyperlipidemia, and diabetes, men had lower HRQOL than women.29
Because declines in HRQOL predict future MS disease progression,4 the present data suggest that it is important that men, in particular, have their health and support needs addressed. Across the sexes, the presence of depressive symptoms was the top predictor of perceived health (Tables 2 and 3). The present finding showing the critical role of depression in this older cohort aligns with other studies examining younger and middle-aged samples of people with MS,30 suggesting that depression remains important to people with MS throughout their lifetime. Although the lifetime prevalence of depression is approximately 50% for people with MS, three times higher than that for the general population,31 depression is a health condition that is treatable.
Based on the present data, we suspect that in this cohort of patients who have mostly retired from their paid work, depression coexists with lower levels of participation in life roles and social activities. Employment provides people with daily structure and social interactions. Social and work-related activities are protective psychological factors that may buffer the effects of aging with MS,32 and sex-specific societal roles may be more disrupted in men with MS versus women with MS.29 We found that although older women were just as likely as men to retire early due to MS (74.5% vs. 78.8%, respectively), women continued to participate in household work and social opportunities more often than older men. Men, on the other hand, drank more alcohol, which was a significant predictor of higher health perception. As with older people with other chronic conditions, participation and social interaction somewhat mitigate the impact of depressive symptoms on HRQOL preferentially in females over males.29 The present findings support the concept that women aging with MS are more resilient. They likely have greater confidence in their ability to cope with challenges and control the course of their disease.33
Along with more often being diagnosed as having primary progressive MS, men may be at further disadvantage of disease progression because of their lifestyle habits. Although the distribution of the alcohol variable was not conducive to dosage analysis, other researchers have shown that moderate levels of alcohol consumption (≤30 g/d for females and ≤45 g/d for males) are associated with higher perceived health, with very high and very low levels not as protective.34 35 Higher intake of fish and fresh fruit and vegetables has also been associated with lower disease burden,35 and men in the present cohort reported lower diet quality than women. Furthermore, because higher resilience predicts higher levels of participation in exercise,27 men experiencing lower resilience and depression may not exercise. These three factors—diet, exercise, and alcohol use—and their association with cardiometabolic risk factors may alter the course of the disease in the long term.20
This study adds important knowledge about aging with MS; however, there are some limitations. The Canadian Survey of Health, Lifestyle, and Aging with MS was a subjective and cross-sectional survey. It was not longitudinal; therefore, we cannot determine causality. With an average age of 65 years, the study sample may better represent the young-old. More research is needed that explores healthy aging in the oldest groups of people with MS, such as octogenarians. Furthermore, because of the nature of survey respondents, it is likely that people with lower levels of education, those with higher levels of disability, and those who live in long-term–care facilities were underrepresented. Although the sample is nationwide and Canada has the highest rates of MS in the world, the context of Canada's relatively strong public health system and higher socioeconomic position may limit the findings of this study to people with MS living in similar conditions. Finally, the models predict less than 30% of the variance in health perception, suggesting that other unmeasured variables, such as disease trajectory, could offer further predictive strength.
Conclusion
Older men exhibit poorer adaptation to aging with MS than do older women, and their health and lifestyle behaviors may place them at greater risk for health deterioration. The most critical predictor of health in both sexes was depression, a condition whose treatment could induce a cascade of protective health behaviors, such as adherence to a healthy diet, exercise, moderate alcohol consumption, and more social engagement. These findings suggest that older men and women with MS require advice and intervention tailored specifically to their needs.
PracticePoints
Despite no differences in age, years with MS, disability, fatigue, and social support, older men experienced lower perceived health and lower resilience and participated less in life roles than older women.
Depression was the strongest predictor of health perception in both women and men.
Older men exhibited poorer adaptation to aging with MS than older women, and their health and lifestyle behaviors may place them at greater risk for health deterioration.
Acknowledgments
The study was supported by the MS Society of Canada and local chapters, provincial MS clinic neurologists, MS nurses, administrative and research staff, and the Rehabilitation and Continuing Care Program (Eastern Health Authority). We specifically acknowledge the work of site coordinators Chelsea Harris, Stephen Hogan, Olivia Manning, Olivia Drodge, Trudy Campbell, Heather Rosehart, Amy Cuthbertson, Darren Nickel, Pam Dumont, Madonna de Lemos, Deborah Goldberg, Irene Yee, Nicholas Hall, Maureen Perera, Sarah Williamson, Carolina Moriello, and Vanessa Bouchard.
References
Miller A, Dishon S. Health-related quality of life in multiple sclerosis: the impact of disability, gender and employment status. Qual Life Res. 2006; 15:259–271.
Hobart J, Lamping D, Fitzpatrick R, Riazi A, Thompson A. The Multiple Sclerosis Impact Scale (MSIS-29): a new patient-based outcome measure. Brain. 2001; 124:962–973.
Rudick RA, Miller D, Clough JD, Gragg LA, Farmer RG. Quality of life in multiple sclerosis: comparison with inflammatory bowel disease and rheumatoid arthritis. Arch Neurol. 1992; 49:1237–1242.
Benito-Leon J, Mitchell AJ, Rivera-Navarro J, Morales-Gonzalez JM. Impaired health-related quality of life predicts progression of disability in multiple sclerosis. Eur J Neurol. 2013; 20:79–86.
Solaro C, Ponzio M, Moran E, et al. The changing face of multiple sclerosis: prevalence and incidence in an aging population. Mult Scler. 2015; 21:1244–1250.
Wilson IB, Cleary PD. Linking clinical variables with health-related quality of life: a conceptual model of patient outcomes. JAMA. 1995; 273:59–65.
Mayo NE, Scott SC, Bayley M, et al. Modeling health-related quality of life in people recovering from stroke. Qual Life Res. 2015; 24:41–53.
Shahrbanian S, Duquette P, Ahmed S, Mayo NE. Pain acts through fatigue to affect participation in individuals with multiple sclerosis. Qual Life Res. 2016; 25:477–491.
Ploughman M, Austin MW, Murdoch M, et al. Factors influencing healthy aging with multiple sclerosis: a qualitative study. Disabil Rehabil. 2012; 34:26–33.
Yamout B, Issa Z, Herlopian A, et al. Predictors of quality of life among multiple sclerosis patients: a comprehensive analysis. Eur J Neurol. 2013; 20:756–764.
Benedict RH, Wahlig E, Bakshi R, et al. Predicting quality of life in multiple sclerosis: accounting for physical disability, fatigue, cognition, mood disorder, personality, and behavior change. J Neurol Sci. 2005; 231:29–34.
Beiske AG, Naess H, Aarseth JH, et al. Health-related quality of life in secondary progressive multiple sclerosis. Mult Scler. 2007; 13:386–392.
Bove R, Chitnis T. The role of gender and sex hormones in determining the onset and outcome of multiple sclerosis. Mult Scler. 2014; 20:520–526.
Upton D, Taylor C. What are the support needs of men with multiple sclerosis, and are they being met? Int J MS Care. 2015; 17:9–12.
Casetta I, Riise T, Wamme Nortvedt M, et al. Gender differences in health-related quality of life in multiple sclerosis. Mult Scler. 2009; 15:1339–1346.
Kopke S, Solari A, Khan F, Heesen C, Giordano A. Information provision for people with multiple sclerosis. Cochrane Database Syst Rev. 2014;4:CD008757.
Ploughman M, Beaulieu S, Harris C, et al. The Canadian survey of health, lifestyle and ageing with multiple sclerosis: methodology and initial results. BMJ Open. 2014;4:e005718.
Ploughman M, Austin M, Stefanelli M, Godwin M. Applying cognitive debriefing to pre-test patient-reported outcomes in older people with multiple sclerosis. Qual Life Res. 2010; 19:483–487.
Ploughman M, Austin MW, Murdoch M, Kearney A, Godwin M, Stefanelli M. The path to self-management: a qualitative study involving older people with multiple sclerosis. Physiother Can 2012; 64:6–17.
Marrie RA, Horwitz RI. Emerging effects of comorbidities on multiple sclerosis. Lancet Neurol. 2010; 9:820–828.
Zigmond AS, Snaith RP. The Hospital Anxiety and Depression Scale. Acta Psychiatr Scand. 1983; 67:361–370.
Godwin M, Pike A, Bethune C. Concurrent and convergent validity of the simple lifestyle indicator questionnaire. 2013;2013:529645.
Mahoney FI, Barthel DW. Functional evaluation: the Barthel Index. Md State Med J. 1965; 14:61–65.
Wade DT, Legh-Smith J, Langton Hewer R. Social activities after stroke: measurement and natural history using the Frenchay Activities Index. Int Rehabil Med. 1985; 7:176–181.
Wagnild GM, Young HM. Development and psychometric evaluation of the Resilience Scale. J Nurs Meas. 1993; 1:165–178.
Weinert C. A social support measure: PRQ85. Nurs Res. 1987; 36:273–277.
Ploughman M, Harris C, Wallack EM, et al. Predictors of exercise participation in ambulatory and non-ambulatory older people with multiple sclerosis. PeerJ. 2015;3:e1158.
Asano M, Duquette P, Andersen R, Lapierre Y, Mayo NE. Exercise barriers and preferences among women and men with multiple sclerosis. Disabil Rehabil. 2013; 35:353–361.
Lin YC, Yeh MC, Chen YM, Huang LH. Physical activity status and gender differences in community-dwelling older adults with chronic diseases. J Nurs Res. 2010; 18:88–97.
Ayatollahi P, Nafissi S, Eshraghian MR, Kaviani H, Tarazi A. Impact of depression and disability on quality of life in Iranian patients with multiple sclerosis. Mult Scler. 2007; 13:275–277.
Sadovnick AD, Remick RA, Allen J, et al. Depression and multiple sclerosis. Neurology. 1996; 46:628–632.
Gulick EE. Correlates of quality of life among persons with multiple sclerosis. Nurs Res. 1997; 46:305–311.
Fraser C, Polito S. A comparative study of self-efficacy in men and women with multiple sclerosis. J Neurosci Nurs. 2007; 39:102–106.
Weiland TJ, Hadgkiss EJ, Jelinek GA, Pereira NG, Marck CH, van der Meer DM. The association of alcohol consumption and smoking with quality of life, disability and disease activity in an international sample of people with multiple sclerosis. J Neurol Sci. 2014; 336:211–219.
D'Hooghe MB, Haentjens P, Nagels G, De Keyser J. Alcohol, coffee, fish, smoking and disease progression in multiple sclerosis. Eur J Neurol. 2012; 19:616–624.