
Publication
Research Article
International Journal of MS Care
Three-Day Dietary Manipulation in Multiple Sclerosis
Abstract
Background:
In persons with multiple sclerosis (MS), the effect of nutrition on exercise performance and fatigue remains unknown. The objective was to determine whether a 3-day diet high in triglycerides (FAT) compared with a 3-day diet high in carbohydrates (CARB) would improve fatigue and exercise performance in persons with MS.
Methods:
A randomized controlled crossover design was incorporated to study FAT versus CARB on submaximal cycling endurance (60% of peak oxygen consumption), substrate utilization, and fatigue in 12 persons with mild-to-moderate MS (Expanded Disability Status Scale score, 2.0–5.0) and 12 age- and sex-matched controls.
Results:
There were no differences in cycling time between diets in either group (P = .29). The MS group had no changes in fatigue between diets (P = .64); the control group demonstrated increased total mental fatigue after FAT (P = .05). The control group increased carbohydrate oxidation by 24% at rest and 13% during exercise after CARB. Similarly, the control group significantly increased fat oxidation after FAT by 22% at rest and 68% during exercise (P = .01). These changes were not seen in the MS group. Compared with controls, persons with MS oxidized approximately 50% less fat during exercise after FAT (P = .05).
Conclusions:
Neither CARB nor FAT altered submaximal exercise performance or baseline fatigue in the MS group. The results suggest that persons with MS are unable to adapt to dietary changes and oxidize fatty acids as efficiently as controls.
Multiple sclerosis (MS) is an immune-modulated disease resulting in fatigue, impaired mobility, and a sedentary lifestyle.1,2 Physical inactivity acts to further potentiate the decline in muscle strength, aerobic exercise capacity, and quality of life commonly seen in persons with MS.3–6 Interventions designed to reduce fatigue and improve exercise performance are needed to improve both short- and long-term health-related outcomes in persons with MS. In studies of athletes and untrained individuals, nutritional interventions were shown to successfully improve exercise performance,7 yet this area of research is nonexistent in persons with MS.
A recent review8 identified that specific dietary patterns and/or nutrients are associated with MS-related risk and symptoms.9–11 For example, diets high in whole grains, low-fat dairy, and meats, including organ meats, as well as lactovegetarian and vegetarian diets that are high in fruits and vegetables and low in saturated fats correlate with a decrease in MS prevalence.9,12 Despite these larger population-based studies, limited work reports how diet directly influences MS-related fatigue and/or function.13,14 Of the limited studies, one demonstrated that physical inactivity combined with a diet low in fruits, vegetables, and whole grains was associated with worse outcomes on the Timed 25-Foot Walk test and the Six-Minute Walk Test (6MWT).13
In contrast to traditional practice guidelines and large population-based studies, Bromley et al15 recently reported that increased daily consumption of fats was associated with improved function as measured by the 6MWT in persons with MS—a finding we rationalized by the notion that fat metabolism is the primary fuel source during low- to moderate-intensity exercise of longer duration (<65% of peak oxygen consumption [VO2peak]).16 Based on traditional exercise physiology and substrate utilization, we therefore hypothesized that the improved performance was secondary to an increased availability of fatty acids to use as fuel. Mahler et al17 recently demonstrated that persons with MS overuse carbohydrates at rest and during low- to moderate-intensity exercise. Results from this work may help explain the decrease in energy production, the fatigue, and/or the premature cessation of exercise commonly seen in persons with MS. Thus, strategies to improve fat oxidation may provide a therapeutic intervention to improve fatigue and/or exercise capacity in MS.
In healthy populations, consuming 3-day diets high in fats or high in carbohydrates is enough to shift substrate utilization to the corresponding diet at rest and during exercise.7,18,19 Thus, using a short-term diet to improve fat utilization to affect fatigue and exercise performance in persons with MS is a warranted strategy and is currently absent from the literature. The purpose of the present study was to determine whether a 3-day diet high in triglycerides (FAT) or a 3-day diet high in carbohydrates (CARB) would alter substrate utilization and lead to improvements in submaximal exercise performance and/or the perception of fatigue in persons with MS compared with a healthy, untrained, non-MS control group. Based on preliminary data,15 we hypothesized that FAT would improve fatty acid oxidation, reduce fatigue, and prolong submaximal exercise time in persons with MS, a response that may differ in the control group.
Methods
Study Design
The present study was a single-blinded, randomized controlled crossover nutritional intervention in persons with MS and age- and sex-matched non-MS controls. All the procedures were approved by the University at Buffalo Human Subjects Institutional Review Board, and voluntary informed consent was provided before participation. Twelve persons with MS and 12 controls completed the study.
Participants
Inclusion criteria for the MS group included neurologist-confirmed MS based on the McDonald criteria, Expanded Disability Status Scale (EDSS) score of 2.0 (minimal disability, ambulatory without assistive device) to 5.0 (moderate disability, ambulatory without assistive device), and aged 20 to 45 years. Controls were matched by age, sex, and body mass index, with no history of cardiopulmonary disease and not actively participating in a structured exercise program. Exclusion criteria for persons with MS included evidence of active disease/relapse or change in disease-modifying medication within the previous 30 days. Exclusion criteria for both groups included diabetes, inflammatory bowel disease, dysphagia, drug/alcohol addiction, and/or a body mass index greater than 35 (calculated as weight in kilograms divided by height in meters squared).
Protocol
The participants reported to the laboratory on three separate occasions after 10 hours of fasting. Visit 1 included consent, diet education, and baseline testing on their habitual diet, including a peak aerobic exercise test to determine the submaximal exercise workload. Visits 2 and 3 were identical except for the research diets consumed for the 3 days before testing and replacement of the peak test with a submaximal exercise test. All testing was performed at the same time of day separated by 1 month to account for washout and menstrual cycle. The examiners were blinded to the research diet.
Dietary Procedures
Dietary Assessment
A registered dietitian educated participants on how to properly answer the following questionnaires: the Food Frequency Scale (participants were asked to quantify the frequency [daily, monthly, yearly] of intake using standardized serving sizes of 116 food items)20,21 and the 3-Day Food Diary (participants were asked to record the type and amount of food and beverages consumed during 3 consecutive days at baseline and during each of the research diets).22 Once the completed questionnaires were returned, the registered dietitian conducted a nutrient analysis to confirm that appropriate ratios of macronutrients were achieved. The dietary assessments were analyzed using Nutritionist Pro software (Axxya Systems LLC). Macronutrients are expressed as percentage of total calories.
Meal Plan Creation
The average total calories consumed per day from the baseline 3-day food diary was used to create the appropriate calorie allocation for each macronutrient on the two intervention diets. In addition, food preferences and most frequently eaten foods were considered when creating the meal plan. Food lists were created and broken down into seven categories based on the American Diabetes Association's Food Lists for Diabetes. The lists provided portion sizes and tips to help participants meet their goals. A guide was also provided that broke down each day by meal and provided the number of foods from each group that the participant should choose. Communications via phone calls were frequently used to ensure compliance. Participants began each intervention 3 days before their scheduled laboratory visit and maintained a 3-day food record during the intervention for adherence.
The macronutrient targets for CARB were 75% carbohydrate, 15% protein, and 10% fat and for FAT were 20% carbohydrate, 15% protein, and 65% fat.
Measurements
Height, Weight, and Body Fat Percentage
Height, weight, and body fat percentage were measured on arrival at the laboratory. Height was measured using a Detecto stadiometer. Weight and bio-impedance body fat percentage were recorded using a Tanita (model BC-558) scale.23
Resting Metabolic Rate
Indirect calorimetry with a canopy system (Vmax Encore 229; Viasys) was used to measure resting metabolic rate (RMR) using the abbreviated Weir equation.24 Participants reported to the laboratory and rested quietly in a supine position for 30 minutes before collection of gas. Once steady state was reached, RMR was measured for 20 to 30 minutes after the resting period.
Peak Exercise Capacity
During the first visit, a progressive exercise test was performed on an electronically braked cycle ergometer (Ergoselect 100; Ergoline GmbH) with a cardiopulmonary exercise testing system (Vmax Encore 229). Participants rested for 3 minutes, followed by 2 minutes of constant-load cycling at a workload equal to 0 W, after which the workload was increased 20 to 30 W every 2 minutes until maximal effort was indicated.25
Time to Exhaustion Test
An open-ended cycling test to fatigue was performed at 60% of VO2peak. The workload remained constant for testing days 2 and 3. Pedal speed was maintained at 50 rpm, and uniform verbal encouragement was provided. During the open-ended exercise test, 30-second averages of carbohydrate and fat oxidation were calculated using standardized formulas26,27 at the following time points: baseline, 1 minute, and 25%, 50%, 75%, and 100% of total exercise time. Carbohydrate oxidation = 4.210(VCO2) − 2.962(VO2); fat oxidation = 1.695(VO2) − 1.701(VCO2).
The 6MWT
Participants were instructed to walk as fast and as safely as they can while covering as much ground as possible over a 100-ft walkway within 6 minutes.28
Actigraph Activity Monitor
Participants were instructed to wear an activity monitor (GT3X+; ActiGraph LLC), validated in persons with MS, on their waist for 6 days to assess baseline activity.29 Average daily physical activity was determined in kilocalories per kilogram per day as previously described.15
Fatigue
The visual analogue scale (VAS) was used at each visit to quantify physical and mental fatigue. Participants were instructed to place a vertical line on a 10-cm horizontal line anchored with “no fatigue” and “severe fatigue.” They were asked to rate their physical and mental fatigue on separate lines. The VAS was assessed at baseline, 10 minutes after the 6MWT, and 10 and 60 minutes after the exercise tests. Fatigue was analyzed at each time point and summed into a total VAS score.30
Blood Collection Procedures
A certified phlebotomist collected blood (20 mL) from the antecubital vein before exercise and again 10-minutes after the open-ended cycling test. Blood processing followed published standardized procedures.31 Serum total cholesterol, high-density lipoprotein cholesterol, triglycerides, insulin, and glucose were assayed using US Food and Drug Administration−approved diagnostic reagents, calibrators, and controls from Sekisui Diagnostics adapted to the ABX Pentra 400 automated chemistry analyzer (Horiba Ltd). Nonesterified fatty acids (NEFAs) were assayed using a diagnostic kit from Wako Chemicals. Low-density lipoprotein cholesterol level was calculated using the Friedewald equation.32
Statistical Analysis
Sample size calculations resulted in a suggested sample size of ten participants in each arm (G*Power 3.1; power = 0.8, α = 0.5, nonsphericity correction = 0.75, and partial eta squared [η2 p] = 0.06).33 All data are reported as mean ± SD. A t test was used for demographic differences between persons with MS and controls. A mixed-factor repeated-measures analysis of variance was used to evaluate within-subject factors of diet and time and between-subject factors of group (MS vs control). A P < .05 was used to determine statistical significance for all tests.
Results
Participants
All 24 participants completed all the visits. There were limited differences in baseline characteristics between the groups. The control group expended approximately 15% more calories at rest (RMR, P = .04) and had a higher VO2peak (+20%, P = .02) compared with the MS group (Table 1).


Baseline demographic characteristics of study groups

Adherence to Dietary Interventions
Table S1, which is published in the online version of this article at ijmsc.org, presents the actual percentage of each macronutrient consumed during the 3-day period calculated for both groups while consuming the two research diets. Overall, both groups demonstrated significant adherence to each diet, and there were no between-group differences seen in macronutrient intake.
Time to Exhaustion
There were no differences in exercise time between diets in either group (P = .29, η2 p = 0.05) or between groups (P = .24, η2 p = 0.06). In the MS group, there was a negligible difference in mean ± SD cycling time between diets (CARB: 23.6 ± 17.8 minutes, FAT: 24.5 ± 15.5 minutes, P = .77). Although not significant, the controls cycled 11% longer on CARB compared with FAT (CARB: 32.0 ± 11.3 minutes, FAT: 28.6 ± 8.3 minutes, P = .19).
Respiratory Exchange Ratio
Resting
In the MS group, there were no differences in the RER between diets at any time point (P ≥ .1) (Figure S1, A). In contrast, the control group exhibited an approximately 5% lower RER on FAT compared with CARB (P ≤ .03) (Figure S1, B). Between groups, the RER was approximately 5% higher in the MS group on FAT (P = .04) (Figure S1, D), with no differences between groups after CARB (P = .6) (Figure S1, C).
During Exercise
In the MS group, there were no differences in the RER between diets at any time point during exercise (Figure S1, A). In contrast, the control group demonstrated an elevated RER at all time points on CARB compared with FAT (Figure S1, B). Between groups, the RER was elevated at the end of exercise in the MS group on FAT (P = .02) (Figure S1, D) compared with in the control group.
Substrate Utilization
In the MS group, there were no differences in fat or carbohydrate oxidation on either diet at any time point during exercise (Figure S2, A and C). In the control group, total carbohydrate oxidation was elevated by 24% at rest and 13% during exercise during the CARB diet. Specifically, during exercise, carbohydrate oxidation was significantly elevated at the 1-minute (P = .005) and 75% (P = .05) time points on CARB compared with FAT (Figure S2, B). The control group significantly increased fat oxidation after FAT by 22% at rest and 68% during exercise (P = .01). Fat oxidation was higher at all time points during exercise on FAT compared with CARB in the control group (P ≤ .001) (Figure S2, D). These changes were not seen in the MS group. Compared with controls, persons with MS oxidized approximately 50% less fat during exercise after FAT (P = .05).
The 6MWT
No differences were seen between CARB and FAT in distance walked in the MS and control groups. The controls walked longer on both diets compared with the MS group (P < .001).
Blood Metabolites
Resting
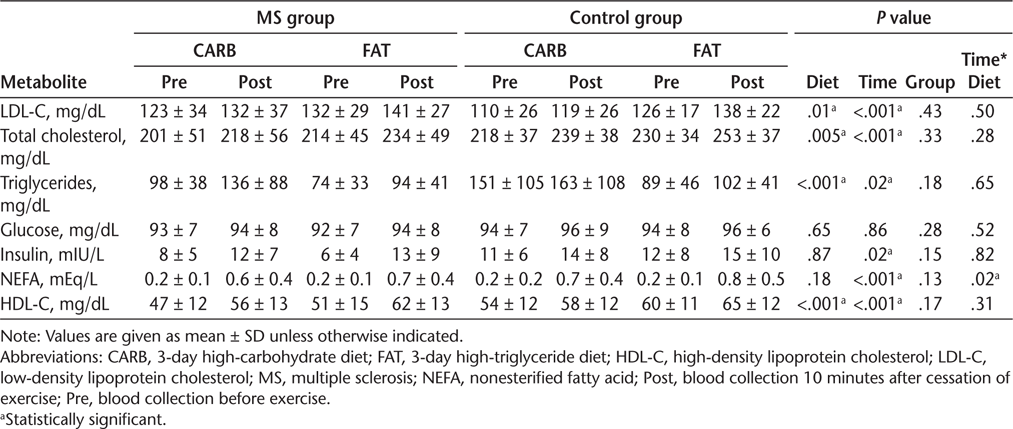
Both the MS and control baseline measurements demonstrated an increase in blood lipid markers after FAT compared with CARB (Table 2).


Effect of diet and exercise on blood metabolites
After Exercise
There was a significant increase in circulating lipid levels (low-density lipoprotein cholesterol, total cholesterol, triglycerides, NEFAs, and high-density lipoprotein cholesterol) seen in both groups following both diets immediately after exercise. However, a significant time × diet interaction was seen for NEFAs. The NEFA level rose more after exercise on FAT in both the MS (10%) and control (7%) groups. No group difference was observed (P = .13).
Fatigue
Mental
In the MS group, neither diet influenced mental fatigue at any time point (Table S2). In the control group, mental fatigue was reduced immediately after the 6MWT (P = .03) and reduced overall (total fatigue, P = .05) on CARB. Between-group comparisons revealed that the control group had less mental fatigue compared with the MS group on CARB (P = .04).
Physical
There were no differences in physical fatigue with respect to diet within each group. However, the MS group reported more fatigue on both diets after the 6MWT compared with the control group (CARB: P = .03, FAT: P = .04). In addition, postexercise (P = .04) and total (P = .03) fatigue were higher on FAT in the MS group compared with the control group.
Discussion
To successfully achieve the primary objectives of this study adherence to the prescribed diets was paramount. The 3-day records verified a difference of less than 10% between the prescribed dietary goals and the actual macronutrients consumed in both groups. We also noted consistent changes in circulating lipid levels, providing further support that the participants were compliant with the prescribed diets. Despite compliance with the prescribed diets, there were no dietary effects on exercise performance or baseline fatigue in either group. Interestingly, neither carbohydrate nor fat oxidation was altered following the experimental diets in persons with MS. In contrast, the control group demonstrated differences in both fat and carbohydrate oxidation after the respective 3-day diets. These important findings suggest that persons with MS have a reduced ability to switch substrate preference despite the increase in bioavailability.
To extend exercise performance and/or reduce fatigue in athletes, dietary manipulation has been utilized in multiple studies.34 Athletes have successfully improved time to exhaustion in both running and cycling activities after 3-day diets high in carbohydrates,35 which is most often considered a diet with 65% or more of total energy coming from carbohydrate intake and 35% or less from fats.36 Conversely, high-fat research diets consist of less than 25% carbohydrates and greater than 60% fats.37 Considering these percentages, we felt confident that the nutritional targets would allow for a 10% deviation without affecting the results. Unlike in athletes, we did not see a difference in submaximal cycling time or fatigue on either research diet for both groups, a finding that may be explained by the inclusion of untrained participants. Endurance athletes, because of their advanced training, have increased utilization of fats both at rest and during exercise.38 A diet high in carbohydrates in this population enhances glycogen storage and glucose availability, optimizing fat and carbohydrate energy systems and prolonging time to exhaustion. In contrast to the athletic population, the ability of dietary manipulation to extend performance is controversial in untrained healthy adults with inferior fat oxidation.37
Even with the purposeful inclusion of inactive individuals, it was somewhat surprising that the control group did not exercise for a longer duration at a workload equivalent to 60% of VO2peak and/or exercise significantly longer than the MS group. Comparable with the present control group, Gosens et al34 found that the average time to exhaustion of 11 untrained men (aged 18–24 years) performing submaximal cycling exercise at a similar workload (65%) was 31 minutes. However, most studies with even untrained individuals recruit people of a higher cardiovascular status than those included in the present study. Our activity monitor data and VO2peak testing revealed that both groups demonstrated poor physical activity and aerobic capacity. Our control group also had somewhat unexpected elevated RER levels, with subsequent negative fat oxidation during CARB through exercise (average RER of 1.01 at 25% and 50% of exercise). Similarly, Alkhatib39 showed comparable RER values at 70% of VO2peak without dietary manipulation and in a younger population. The excessive carbohydrate intake and poorer cardiovascular conditioning in our controls may help explain the higher RER values.39
Unfortunately, we were unable to reduce fatigue on either of the short experimental diets, unlike longer-term dietary changes in persons with MS. Most long-term diets consist of decreasing saturated fats and increasing fruit and vegetable intake with an aim of improving lipid markers, maintaining or improving functional level, and reducing MS lesion load.8 Our aim differed from these previous studies in this population because it was to determine whether we could affect short-term metabolism to improve exercise tolerance to further elucidate mechanisms of fatigue. Our nonsignificant findings are most likely the result of a failure to affect the MS group's substrate preference.
The inability of the MS group to shift substrate preference confirmed metabolic inflexibility. Metabolic flexibility or inflexibility has also been studied in persons with MS (EDSS score, 2) using a euglycemic hyperinsulinemic clamp after an oral glucose load to examine the effect of a carbohydrate load on resting and exercise substrate utilization.17,40 Similar to the present work, there were no differences in resting RER between an MS group and a matched control group after a 12-hour overnight fast. After an oral glucose tolerance test, the RER was significantly elevated at rest in the MS group compared with controls, suggesting more reliance on carbohydrate oxidation in persons with MS. In addition, the same study demonstrated an inflated RER response following the initiation of a 40-minute submaximal exercise protocol that concluded with a drop in RER below resting values in persons with MS. The overutilization of carbohydrates represented by the unstable fluctuation of the RER could represent a mechanism of fatigue both during rest and after exercise.
To assess lipid mobilization for the adipose tissue, measurements of NEFAs were included. After exercise NEFAs were significantly elevated following both experimental diets and rose substantially more on FAT. Importantly, this implies a healthy hormonal response to exercise in a fasted state in both the control and MS groups. When energy is in demand, circulating hormones trigger triglycerides to be mobilized into NEFAs. In our study, persons with MS demonstrated an increases in both circulating lipids and NEFAs, which may suggest that the inability to switch to fat oxidation is not caused by a hormonal or circulation issue. Instead, the present data suggest that a limiting factor to oxidizing fat in MS may be mitochondrial dysfunction, which has previously been shown to be prevalent in MS.41
When energy is in demand and oxygen is present, nutrients will be transported across the cell and mitochondrial membrane to produce energy. Fatty acid catabolism requires mutliple protein carriers and enzymeatic activity, resulting in a much higher metabolic cost than glucose metabolism. Therefore, mitochondrial dysregulation will negatively impact energy production and favor glucose metabolism.42 Multiple studies report lower oxidative capacity due to mitochondrial dysfunction in skeletal muscles in persons with MS.43 In addition to the changes at a cellular level, lipid metabolism may be altered at the transcriptional level in persons with MS due to the dysregulation of peroxisome proliferator-activated receptors.43 These receptors ultimately affect the expression of proteins that are vital to fatty acid oxidation in the mitochondria.
The limitations of the present study include a limited sample size, and the statistical significance not being adjusted to account for multiple comparisons. Future studies may benefit from providing meals to the participants to reduce self-reported error and offer improved control of macronutrient intake. In addition, increasing the length of the dietary intervention is warranted to determine whether longer manipulation of intake would have an effect on transcriptional factors of fat oxidation and mitochondrial function and, therefore, exercise performance.
In summary, this was the first study, to our knowledge, to examine the effects of 3-day diets high in fats or carbohydrates on fatigue, exercise tolerance, and substrate utilization in persons with MS and a matched control group. Although there were no differences in exercise tolerance on either diet for either group, there were differences in mental fatigue and substrate preference between controls and persons with MS. The present results support previous work suggesting a reduced ability to switch between available substrates for energy production at rest and during submaximal exercise in persons with MS.
PRACTICE POINTS
Persons with MS may have a reduced ability to oxidize fatty acids during low-to-moderate exercise.
Assessing nutritional intake should be a component of the comprehensive evaluation in persons with MS.
Long-term strategies to improve fatty acid oxidation, such as improving healthy fat intake, reducing refined carbohydrate intake, and improving fitness, may affect fatigue in persons with MS.
Acknowledgment
With eternal gratitude to Dr. Susan E. Bennett (1955–2020).
References
Tallner A, Waschbisch A, Wenny I, et al. Multiple sclerosis relapses are not associated with exercise. Mult Scler . 2012; 18: 232– 235.
Waschbisch A, Tallner A, Pfeifer K, Maurer M. Multiple sclerosis and exercise: effects of physical activity on the immune system. Article in German. Der Nervenarzt . 2009; 80: 688– 692.
Marrie RA, Reider N, Cohen J, et al. A systematic review of the incidence and prevalence of cardiac, cerebrovascular, and peripheral vascular disease in multiple sclerosis. Mult Scler . 2015; 21: 318– 331.
Mostert S, Kesselring J. Effects of a short-term exercise training program on aerobic fitness, fatigue, health perception and activity level of subjects with multiple sclerosis. Mult Scler . 2002; 8: 161– 168.
Bergamaschi R, Romani A, Versino M, Poli R, Cosi V. Clinical aspects of fatigue in multiple sclerosis. Funct Neurol . 1997; 12: 247– 251.
Sutherland G, Andersen MB. Exercise and multiple sclerosis: physiological, psychological, and quality of life issues. J Sports Med Phys Fitness . 2001; 41: 421– 432.
Correia-Oliveira CR, Bertuzzi R, Dal'Molin Kiss MA, Lima-Silva AE. Strategies of dietary carbohydrate manipulation and their effects on performance in cycling time trials. Sports Med . 2013; 43: 707– 719.
Riccio P, Rossano R. Nutrition facts in multiple sclerosis. ASN Neuro . 2015; 7: 1759091414568185.
Bitarafan S, Harirchian MH, Nafissi S. et al. Dietary intake of nutrients and its correlation with fatigue in multiple sclerosis patients. Iran J Neurol . 2014; 13: 28– 32.
Jahromi SR, Toghae M, Jahromi MJ, Aloosh M. Dietary pattern and risk of multiple sclerosis. Irani J Neurol . 2012; 11: 47– 53.
Maker-Clark G, Patel S. Integrative therapies for multiple sclerosis. Dis Mon . 2013; 59: 290– 301.
Bagheri M, Maghsoudi Z, Fayazi S, Elahi N, Tabesh H, Majdinasab N. Several food items and multiple sclerosis: a case-control study in Ahvaz (Iran). Iran J Nurs Midwifery Res . 2014; 19: 659– 665.
Balto JM, Ensari I, Hubbard EA, Khan N, Barnes JL, Motl RW. Co-occurring risk factors in multiple sclerosis. Am J Health Behav . 2017; 41: 76– 83.
Bitarafan S, Saboor-Yaraghi A, Sahraian MA, et al. Effect of vitamin A supplementation on fatigue and depression in multiple sclerosis patients: a double-blind placebo-controlled clinical trial. Iran J Allergy Asthma Immunol . 2016; 15: 13– 19.
Bromley L, Horvath PJ, Bennett SE, Weinstock-Guttman B, Ray AD. Impact of nutritional intake on function in people with mild-to-moderate multiple sclerosis. Int J MS Care . 2019; 21: 1– 9.
Purdom T, Kravitz L, Dokladny K, Mermier C. Understanding the factors that effect maximal fat oxidation. J Int Soc Sports Nutr . 2018; 15: 3.
Mahler A, Steiniger J, Bock M, et al. Is metabolic flexibility altered in multiple sclerosis patients? PLoS One . 2012; 7: e43675.
Lima-Silva AE, De-Oliveira FR, Nakamura FY, Gevaerd MS. Effect of carbohydrate availability on time to exhaustion in exercise performed at two different intensities. Braz J Med Biol Res . 2009; 42: 404– 412.
Pogliaghi S, Veicsteinas A. Influence of low and high dietary fat on physical performance in untrained males. Med Sci Sports Exerc . 1999; 31: 149– 155.
Block G, Hartman AM, Dresser CM, Carroll MD, Gannon J, Gardner L. A data-based approach to diet questionnaire design and testing. Am J Epidemiol . 1986; 124: 453– 469.
Block G, Woods M, Potosky A, Clifford C. Validation of a self-administered diet history questionnaire using multiple diet records. J Clin Epidemiol . 1990; 43: 1327– 1335.
Ortega RM, Perez-Rodrigo C, Lopez-Sobaler AM. Dietary assessment methods: dietary records. Nutr Hosp . 2015; 31( suppl 3): 38– 45.
Lemos T, Gallagher D. Current body composition measurement techniques. Curr Opin Endocrinol Diabetes Obes . 2017; 24: 310– 314.
Cadena M, Sacristan E, Infante O, Escalante B, Rodriguez F. Steady state condition in the measurement of VO2 and VCO2 by indirect calorimetry. Conf Proc IEEE Eng Med Biol Soc . 2005; 2005: 7773– 7776.
Heine M, Hoogervorst EL, Hacking HG, Verschuren O, Kwakkel G. Validity of maximal exercise testing in people with multiple sclerosis and low to moderate levels of disability. Phys Ther . 2014; 94: 1168– 1175.
Jeukendrup AE, Wallis GA. Measurement of substrate oxidation during exercise by means of gas exchange measurements. Int J Sports Med . 2005; 26( suppl 1): S28– S37.
Weir JB. New methods for calculating metabolic rate with special reference to protein metabolism. J Physiol . 1949; 109: 1– 9.
ATS Committee on Proficiency Standards for Clinical Pulmonary Function Laboratories. ATS statement: guidelines for the six-minute walk test. Am J Respir Crit Care Med . 2002; 166: 111– 117.
Weikert M, Motl RW, Suh Y, McAuley E, Wynn D. Accelerometry in persons with multiple sclerosis: measurement of physical activity or walking mobility? J Neurol Sci . 2010; 290: 6– 11.
Moumdjian L, Gervasoni E, Van Halewyck F, et al. Walking endurance and perceived symptom severity after a single maximal exercise test in persons with mild disability because of multiple sclerosis. Int J Rehabil Res . 2018; 41: 316– 322.
Tuck MK, Chan DW, Chia D, et al. Standard operating procedures for serum and plasma collection: Early Detection Research Network Consensus Statement Standard Operating Procedure Integration Working Group. J Proteome Res . 2009; 8: 113– 117.
Warnick GR, Knopp RH, Fitzpatrick V, Branson L. Estimating low-density lipoprotein cholesterol by the Friedewald equation is adequate for classifying patients on the basis of nationally recommended cutpoints. Clin Chem . 1990; 36: 15– 19.
Cohen J. Statistical Power Analysis for the Behavioral Sciences . 2nd ed. Lawrence Erlbaum Associates; 1988: 273– 405.
Gosens W, Oomen J, Hesselink M, Borghouts L. Reliability of time–trial versus time-to-exhaustion cycle tests in healthy untrained subjects. J Sci Cycling . 2015; 4. Published December 10, 2015. https://jsc-journal.com/index.php/JSC/article/view/227
Ormsbee MJ, Bach CW, Baur DA. Pre-exercise nutrition: the role of macronutrients, modified starches and supplements on metabolism and endurance performance. Nutrients . 2014; 6: 1782– 1808.
Manore MM. Exercise and the Institute of Medicine recommendations for nutrition. Curr Sports Med Rep . 2005; 4: 193– 198.
Burke LM. Re-examining high-fat diets for sports performance: did we call the ‘nail in the coffin’ too soon? Sports Med . 2015; 45( suppl 1): S33– S49.
Jeukendrup AE. Regulation of fat metabolism in skeletal muscle. Ann N Y Acad Sci . 2002; 967: 217– 235.
Alkhatib A. Yerba Mate (Illex Paraguariensis) ingestion augments fat oxidation and energy expenditure during exercise at various submaximal intensities. Nutr Metab (Lond) . 2014; 11: 42.
Bromley LE. 3- Day Dietary Manipulation in Multiple Sclerosis: Impact on Exercise Performance and Fatigue . Dissertation. Accessed February 26, 2021. https://ubir.buffalo.edu/xmlui/bitstream/handle/10477/78015/Bromley_buffalo_0656A_15738.pdf?sequence=3&isAllowed=y)
Varhaug KN, Vedeler CA, Tzoulis C, Bindoff LA. Multiple sclerosis: a mitochondria-mediated disease? Article in Norweign. Tidsskr Nor Laegeforen . 2017; 137: 284– 287.
Su KG, Banker G, Bourdette D, Forte M. Axonal degeneration in multiple sclerosis: the mitochondrial hypothesis. Curr Neurol Neurosci Rep . 2009; 9: 411– 417.
Corthals AP. Multiple sclerosis is not a disease of the immune system. Q Rev Biol . 2011; 86: 287– 321.
Supplementary Material