
Publication
Research Article
International Journal of MS Care
Development and Cross-Validation of a Simple Model to Estimate Percent Body Fat in Persons with Multiple Sclerosis
Abstract
Background:
Persons with multiple sclerosis (MS) have higher body composition variability compared with the general population. Monitoring body composition requires accurate methods for estimating percent body fat (%BF). We developed and cross-validated an equation for estimating %BF from body mass index (BMI) and sex in persons with MS.
Methods:
Seventy-seven adults with MS represented the sample for the equation development. A separate sample of 33 adults with MS permitted the equation cross-validation. Dual-energy x-ray absorptiometry (DXA) provided the criterion %BF.
Results:
The model including BMI and sex (mean ± SD age: women, 49.2 ± 8.8 years; men, 48.6 ± 9.8 years) had high predictive ability for estimating %BF (P < .001, R2 = 0.77, standard error of estimate = 4.06%). Age, MS type, Patient-Determined Disease Steps score, and MS duration did not improve the model. The equation was %BF = 3.168 + (0.895 × BMI) − (10.191 × sex); sex, 0 = woman; 1 = man. The equation was cross-validated in the separate sample (age: women, 48.4 ± 9.4 years; men, 43.8 ± 15.4 years) based on high accuracy as indicated by strong association (r = 0.89, P < .001), nonsignificant difference (mean: 0.2%, P > .05), small absolute error (mean: 2.7%), root mean square error (3.5%), and small differences and no bias in Bland-Altman analysis (mean difference: 0.2%, 95% CI: −6.98 to 6.55, rs = −0.07, P = .702) between DXA-determined and equation-estimated %BF.
Conclusions:
Health care providers can use this developed and cross-validated equation for estimating adiposity in persons with MS when DXA is unavailable.
Multiple sclerosis (MS) is a prevalent immune-mediated disease of the central nervous system that results in demyelination and transection of axons and loss of neurons in the brain, brain stem, and spinal cord.1 The disease itself and associated central nervous system damage result in a variety of consequences, including cognitive impairment, mobility difficulties, fatigue, depression, and pain,2 that might influence diet and physical activity behaviors as primary determinants of body composition. There has further been some evidence of altered body composition, including body fat, in persons with MS, and body fat has been associated with disability, pain symptoms, physical function, bone health, cardiorespiratory fitness, and health-related quality of life in this population.3–5 Body composition, particularly body fat, might be associated with the excessive rate of comorbid conditions, particularly cardiovascular abnormalities, in persons with MS.6 In addition, persons with MS are at higher risk for overweight/obesity compared with persons without MS.7–9 The higher risk of obesity is further associated with increasing risk of disability and pain and lower quality of life and general health in adults with MS.7,9–11 Moreover, there is increasing evidence that overweight may contribute to increased disability progression12 and relapses in first-line therapy responses in MS.13 Given the adverse health consequences of obesity on the treatment and course of MS, examining the body fat is a further priority for general health research for the MS population. Therefore, measuring the body fat of these individuals using a simple tool may be useful for the development of interventions for reducing obesity in MS. Collectively, this accumulated knowledge makes the quantification of body fat in people with MS important for research and clinical practice.
Dual-energy x-ray absorptiometry (DXA) is an accurate technique for measuring percent body fat (%BF) in the general population and in persons with MS.14,15 This laboratory-based technique, however, requires sophisticated technical skills and is time-consuming and expensive for population surveillance and clinical practice.14 Accordingly, a simple anthropometric measurement may represent an alternative method for accurately estimating %BF. Body mass index (BMI), defined as weight in kilograms divided by height in meters squared, is a common anthropometric measure for evaluating %BF in the general population of adults. Furthermore, BMI is a strong correlate of %BF in samples of adults with and without MS.16
By extension, prediction equations based on BMI have been developed for estimating %BF in the general population.17–19 These prediction equations, however, may not accurately estimate %BF in persons with MS because MS is associated with significant variability in body composition variables and distribution compared with non-MS samples. For example, previous studies reported that adults with MS had higher fat and lower lean mass and bone mineral density and content in the whole body, arms, legs, or trunk compared with adults without MS.3,20–23 Therefore, the development and validation of a specific, simple, and accurate prediction equation based on BMI would help health care providers and researchers in evaluating adiposity in adults with MS.
This study developed and cross-validated a simple prediction equation for estimating %BF from BMI, sex, and other potential independent variables in persons with MS. We further compared the performance of the equation derived in this sample of persons with MS with an existing BMI-based equation for adults from the general population.17
Methods
Participants
This research involved a secondary analysis of body composition assessment data completed by one of us (R.W.M.) from two separate studies.3,24 Both studies were approved by university institutional review boards. All the participants provided written informed consent. The larger sample (n = 77) yielded development of the %BF prediction equation, and the smaller sample (n = 33) provided cross-validation of the equation.
Development Sample
The development sample included baseline data from participants enrolled in a physical activity intervention for persons with MS.24 The inclusion criteria for the intervention were 1) age 18 to 64 years, 2) relapse-free for at least 30 days, 3) internet access, 4) ability to walk with or without assistance, 5) physician approval of participation in physical activity and confirmation of MS diagnosis, and 6) willingness to complete all the study outcomes. Seventy-seven adults with MS completed DXA measurements and were included in the development sample for the study.
Cross-Validation Sample
The cross-validation sample included participants enrolled in a cross-sectional study examining body composition and physical functioning in persons with MS.3 The inclusion criteria for this study were 1) community dwelling, 2) physician confirmation of MS diagnosis, 3) ability to walk with or without single-point assistance, 4) abstained from smoking for 6 or more months, 5) relapse-free for at least 30 days, and 6) willingness to complete all the study outcomes. Thirty-three adults with MS completed DXA and were included in the cross-validation sample for the study.
Outcomes
Anthropometry
Both studies used DXA, a Hologic QDR 4500a bone densitometer (software version 11.2; 12.7.3), for assessing body composition. Whole-body %BF was the primary outcome of interest for this study. In addition, participant body weight and height were measured to the nearest 0.01 kg and 0.01 cm, respectively, using a calibrated scale and a wall-mounted stadiometer. The BMI was then determined as weight in kilograms divided by height in meters squared.
Demographic and Clinical Characteristics
Participants self-reported sex, current age, disease duration, and MS clinical course. The Patient-Determined Disease Steps (PDDS) scale measured self-reported disability status; this scale has been validated and is widely applied in persons with MS.25,26
Data Analysis
Data analyses were undertaken using SPSS Statistics for Windows, version 25.0 (IBM Corp) with the alpha level set at 0.05. Normality was examined using histograms, box plots, Q-Q-plots, and the Shapiro-Wilk test. Independent-samples t tests were used to compare age, anthropometry, and MS duration, and χ2 tests were used to compare MS type and PDDS scale scores between the development and cross-validation studies. Univariate and multivariate outliers were examined for the dependent (%BF) and independent (BMI, sex, age, MS type, PDDS scale score, and MS duration) variables based on previous recommendations.27 Potential univariate or multivariate outliers were examined based on Cook and Mahalanobis distances.
Model Development
Hierarchical linear regression was conducted to develop a prediction equation (MS equation). The first approach for entry of variables was based on theoretical rationale. Past research has demonstrated that BMI, sex, age, MS type, PDDS scale score, and MS duration potentially predict body fat in persons with MS.5,16,21 The second approach was based on magnitude of bivariate associations between the dependent and independent variables based on the Spearman rho rank-order correlation coefficient (rs). Goodness-of-fit of the final model was assessed using R2 and standard error of estimate (SEE).
Model Cross-Validation
We estimated the %BF of participants with MS in the cross-validation study using the prediction equation developed in the previous step. The association between %BF as measured by DXA and %BF as estimated by the MS equation was performed using the Pearson correlation coefficient (r). Generalizability of the model was evaluated by comparing the R2 of the regression model and the square of the Pearson correlation coefficient in the cross-validation; a large difference between these indicators suggests low generalizability of the regression equation.27 A paired-samples t test was further used to evaluate the differences between DXA-determined %BF and MS equation−estimated %BF. A Bland-Altman plot,28 mean absolute error (MAE), and root mean square error (RMSE) were used to examine the agreement between the two techniques of %BF determination. Spearman rho rank-order correlation coefficient was used to examine the relationship between the differences (DXA-determined %BF − MS equation−estimated %BF) against their average as previously recommended.28 We further estimated %BF using a previously published equation for the general population of adults by Deurenberg and colleagues.17 The Deurenberg equation is: %BF = 1.20 × BMI + 0.23 × age − 10.8 × sex − 5.4; for sex, 0 = woman; 1 = man. The accuracy of the MS equation was then compared with that by Deurenberg et al17 using MAE, RMSE, and Bland-Altman plots. The Wilcoxon signed rank test was used to evaluate the differences in MAE because this variable was not normally distributed.
Results
Participants
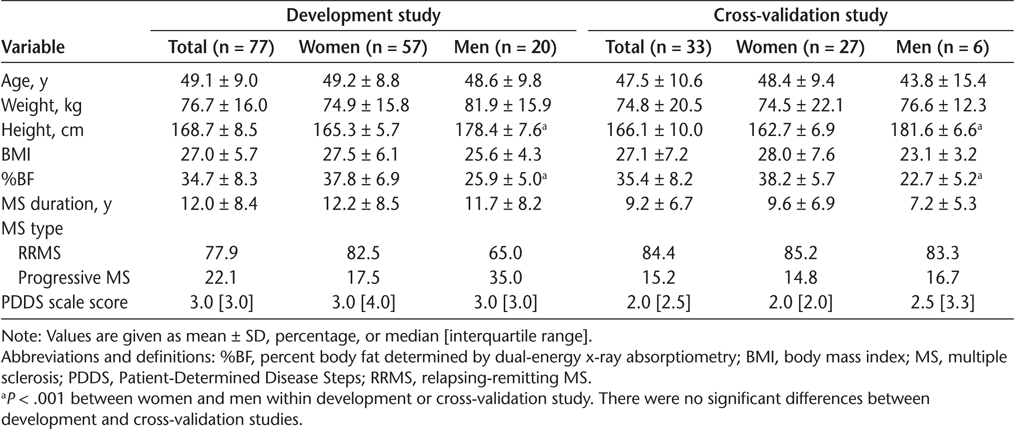
The characteristics of the participants are presented in Table 1. The development model study included 77 participants (57 women; mean ± SD age, 49.1 ± 9.0 years). The cross-validation study included 33 participants (27 women; mean ± SD age, 47.5 ± 10.6 years). Age, BMI, DXA-determined %BF, MS type, PDDS scale score, and MS duration were not significantly different between the development and cross-validation studies (all P > .05) (Table 1).


Characteristics of participants in development and cross-validation studies
Model Development
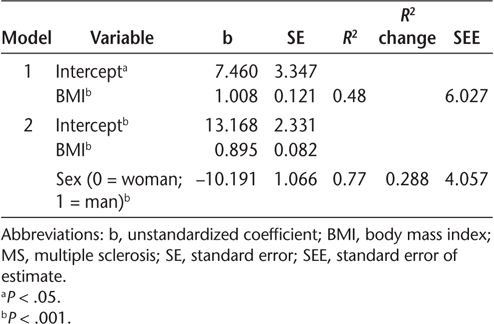
There were significant Spearman correlations between BMI (r s = 0.72, P < .001) and sex (r s = −0.63, P < .001) with %BF. Spearman correlations of age, MS type, PDDS scale score, and MS duration with %BF ranged from −0.15 to 0.19 and were not significant (P > .05). The BMI was a significant predictor of %BF in the hierarchical regression (P < .001, R 2 = 0.48, SEE = 6.03 %BF). Sex was a significant predictor and explained an additional 29% of the variance in %BF (P < .001; R2 change = 0.288; SEE = 4.06 %BF). Inclusion of additional variables (age, MS type, PDDS scale score, and MS duration) did not improve the model. The final multivariable model included BMI and sex (P < .001; R2 = 0.77; SEE = 4.06% BF) (Table 2 and Figure S1, which is published in the online version of this article at ijmsc.org). The equation for %BF estimation in persons with MS was %BF = 13.168 + (0.895 × BMI) − (10.191 × sex); for sex, 0 = woman; 1 = man.


Hierarchical regression models predicting dual-energy x-ray absorptiometry percent body fat in persons with MS
Model Cross-Validation
There was a significant association between the %BF determined from DXA and that estimated from the MS equation in the cross-validation sample (Figure S2) (r = 0.89, P < .001). The square of the correlation coefficient for the association between DXA-determined %BF and MS equation−estimated %BF (0.79) was similar to the R2 of the developed model (0.77), indicating high generalizability of the regression equation.27 There were no significant mean ± SD differences between DXA-determined %BF and MS equation−estimated %BF in the cross-validation sample (35.4% ± 8.2% and 35.6% ± 8.4%, respectively, P > .05). The mean ± SD MAE for %BF with the present equation was 2.7% ± 2.1%, and the RMSE was 3.5%. The mean difference between DXA-determined %BF and MS equation−estimated %BF in the Bland-Altman plot was 0.2% (95% CI, −6.98 to 6.55) (Figure S3). In addition, there was no significant association for the differences between DXA-determined %BF and MS equation−estimated %BF against the average (rs = −0.07, P = .702) (Figure S3); this indicated no bias between the techniques.
Deurenberg Equation Performance
The Deurenberg equation had reasonable predictive performance for %BF in the cross-validation study compared with the MS equation. The Pearson correlation coefficient indicated strong associations between DXA-determined %BF and Deurenberg equation−estimated %BF (r = 0.92, P < .001). In addition there was no significant mean ± SD difference between DXA-determined %BF and Deurenberg equation−estimated %BF (35.4% ± 8.2% and 36.1% ± 11.5%, respectively, P > .05). However, there was a significant association for the differences between the techniques against the average (rs = −0.53, P = .001) (Figure S3); this indicated a systematic error of the Deurenberg equation in estimating %BF. Moreover, the Deurenberg equation had a slight mean %BF overestimation and wide limits of agreement (Figure S3) (mean error: 0.7%, 95% CI: −10.9 to 9.4) with an MAE of 3.7% and an RMSE of 5.3%. However, there was no difference in MAEs between the MS and Deurenberg equations in the Wilcoxon signed rank test (P > .05).
Discussion
We developed and cross-validated an equation for estimating %BF from BMI and sex in persons with MS. We further compared the accuracy of the MS equation with that of an existing equation for the general population. We observed that the present model including BMI and sex demonstrated good predictive ability, with high accuracy in estimating %BF in adults with MS. Moreover, we observed that the equation for the general population tended to bias the %BF estimation compared with the presently developed MS equation. The generation of an equation based on simple anthropometric and demographic measures may provide clinical researchers and health providers with an important end point in addressing adiposity-related determinants in MS.
This study provided evidence that BMI and %BF are strongly associated in adults with MS. This finding is consistent with research reporting a strong association between BMI and %BF in adults with MS.16 We further reported that BMI explained 48% of the variance in %BF, somewhat close to that of 42% from a previous study in MS.16 These data suggest that BMI is a reasonable predictor of adiposity in this population. It should be considered, however, that BMI alone did not explain 52% of the variance in %BF in the present study. It is well documented that sex is a strong predictor of %BF.17,18,29 This necessitated an examination of the potential contribution of sex on the %BF prediction in MS. This is the first study examining the magnitude of the relationship between sex and %BF in adults with MS. Accordingly, the regression analysis indicated that sex provided an additional 29% of the explained variation in %BF. This complements previous studies demonstrating that sex is a significant predictor of %BF, with a similar R2 change of 27% in persons without MS.17 The effect of sex is logical because women show higher %BF than men in persons with and without MS,5,17,18,21,30 primarily associated with inherent sex differences in essential fat proportion.31 Collectively, these findings indicated that BMI and sex were strong predictors of %BF and were, therefore, included in the equation estimating %BF in adults with MS.
The equation developed in this study cross-validated acceptably for estimating %BF in a separate sample with MS. We observed that errors between DXA-determined and equation-estimated %BF were relatively small in the cross-validation sample. There further was a small difference on the proportion of the variance of %BF between the development and cross-validations samples, and this indicated high generalizability of the equation. In addition, we did not find any significant difference between DXA-determined and equation-estimated %BF mean values. This is in agreement with research demonstrating high correlations and relatively small differences between actual and estimated %BF in adults without MS.18 Another important observation was that our equation resulted in a nearly-zero mean error of %BF and no indication of bias in the Bland-Altman plot. In addition, we observed that the 95% limits of agreement were relatively narrow. The present results, therefore, indicate that this equation is accurate for estimating %BF in persons with MS.
Another important next step involved comparing the agreement of the present MS equation and that of an existing BMI-based equation (the Deurenberg equation) developed for adults without MS. Although there was a strong and significant association between DXA-determined and Deurenberg equation−estimated %BF, we observed both consistent bias and wider 95% limits of agreement in the Bland-Altman plot. One possible explanation for the differences in the equation's performance is that adults with MS present with a high variability in body composition compared with adults without MS.3,20,21 Other possible factors might include the proportion of %BF between samples. For example, the mean %BF for the Deurenberg sample was 25% compared with the present overall sample mean of 35%. Note that the Deurenberg equation included age in the model and the MS equation did not; we observed no bivariate and multivariate associations between age and %BF. The final consideration is that the %BF measure criterion for the Deurenberg equation was based on underwater weighing, and this results in substantial %BF differences compared with DXA.32 Collectively, these findings indicated that a specific equation for %BF for adults with MS generally performs better than an equation for adults without MS.
There is evidence that individuals with MS are at higher risk for obesity than the general population.7–9 Body fat further is a risk factor for comorbidities and health-related physical fitness and quality of life in MS.3–6 The presently developed equation for %BF may, therefore, be useful in monitoring adiposity and developing programs for improving health and fitness in adults with MS. The equation included two simple measures (ie, BMI and sex) and may be easily and routinely applied in clinical settings by health providers, and even by individuals with MS in their homes. In addition, the equation may allow researchers to examine how %BF determines or changes physical activity patterns in large-scale surveillance research in adults with MS. This has important implications for research because adults with MS are at higher risk for physical inactivity.33 Higher %BF levels have been associated with lower levels of physical activity in this population.34 Moreover, exercise professionals and researchers may use this equation for monitoring adiposity in persons with MS in exercise programs. Monitoring body composition and its influence on the physical fitness of individuals with MS affords exercise specialists an opportunity to support programs for reducing body fat in MS. This is particularly relevant as the number of adults with MS engaging in lifestyle modification programs continues to increase. For example, a 6-month, internet-delivered lifestyle physical activity intervention has been found to potentiate changes in DXA-determined %BF in persons with MS.35 Whether internet-delivered exercise approaches consistent with previous methods and procedures might offer significant changes in MS equation−estimated %BF should be addressed in futures studies. Taken together, monitoring the %BF of adults with MS using a simple equation may advance clinical practice and research in this area.
There are clear limitations of this study. The samples may not be representative of the whole MS population because most participants had relapsing-remitting MS. There was a small sample size of men in the cross-validation study, and this further limited the generalizability of the equation. However, all men were within 95% limits of agreement in the Bland-Altman plot. Nevertheless, future studies should confirm the accuracy of this equation in males with MS. All the participants were independently ambulatory, further limiting generalizability for adults who have severe ambulatory disability.
In conclusion, we provide evidence that BMI and sex are significant predictors of %BF in adults with MS. This results in a simple equation including BMI and sex for estimating %BF that was cross-validated in a separate sample of adults with MS. The provision of this equation will be important for providing a simple option for health professionals and researchers for monitoring %BF and addressing adiposity-related issues in MS.
PRACTICE POINTS
Body mass index and sex are significant predictors of percent body fat in persons with MS.
An equation with body mass index and sex is accurate for estimating percent body fat in adults with MS.
The equation is simple and may aid health providers in monitoring adiposity in patients with MS.
Financial Disclosures
The authors declare no conflicts of interest.
References
What is MS? National Multiple Sclerosis Society. Published 2020. https://www.nationalmssociety.org/What-is-MS
Kister I, Bacon TE, Chamot E, et al. Natural history of multiple sclerosis symptoms. Int J MS Care . 2013; 15: 146– 158.
Ward CL, Suh Y, Lane AD, et al. Body composition and physical function in women with multiple sclerosis. J Rehabil Res Dev . 2013; 50: 1139– 1147.
Mojtahedi MC, Snook EM, Motl RW, Evans EM. Bone health in ambulatory individuals with multiple sclerosis: impact of physical activity, glucocorticoid use, and body composition. J Rehabil Res Dev . 2008; 45: 851– 862.
Pilutti LA, Motl RW. Body composition and disability in people with multiple sclerosis: a dual-energy x-ray absorptiometry study. Mult Scler Relat Disord . 2019; 29: 41– 47.
Baynard T, Hilgenkamp TIM, Schroeder EC, Motl RW, Fernhall B. Measures of adiposity differentially correlate with C-reactive protein among persons with multiple sclerosis. Mult Scler Relat Disord . 2018; 25: 1– 4.
Marrie RA, Horwitz R, Cutter G, Tyry T, Campagnolo D, Vollmer T. High frequency of adverse health behaviors in multiple sclerosis. Mult Scler . 2009; 15: 105– 113.
Pilutti LA, Dlugonski D, Pula JH, Motl RW. Weight status in persons with multiple sclerosis: implications for mobility outcomes. J Obes . 2012; 2012: 868256.
Khurana SR, Bamer AM, Turner AP, et al. The prevalence of overweight and obesity in veterans with multiple sclerosis. Am J Phys Med Rehabil . 2009; 88: 83– 91.
Marck CH, Neate SL, Taylor KL, Weiland TJ, Jelinek GA. Prevalence of comorbidities, overweight and obesity in an international sample of people with multiple sclerosis and associations with modifiable lifestyle factors. PLoS One . 2016; 11: 148573.
Filippatou AG, Lambe J, Sotirchos ES, et al. Association of body mass index with longitudinal rates of retinal atrophy in multiple sclerosis. Mult Scler . 2020; 26: 843– 854.
Paz-Ballesteros WC, Monterrubio-Flores EA, de Jesús Flores-Rivera J, Corona-Vázquez T, Hernández-Girón C. Cigarette smoking, alcohol consumption and overweight in multiple sclerosis: disability progression. Arch Med Res . 2017; 48: 113– 120.
Huppke B, Ellenberger D, Hummel H, et al. Association of obesity with multiple sclerosis risk and response to first-line disease modifying drugs in children. JAMA Neurol . 2019; 76: 1157– 1165.
Heymsfield SB, Lohman TG, Wang Z, Going SB. Human Body Composition . 2nd ed. Human Kinetics; 2005.
Lohman TG, Milliken LA. ACSM's Body Composition Assessment . Human Kinetics; 2020.
Pilutti LA, Motl RW. Body mass index underestimates adiposity in persons with multiple sclerosis. Arch Phys Med Rehabil . 2016; 97: 405– 412.
Deurenberg P, Weststrate JA, Seidell JC. Body mass index as a measure of body fatness: age- and sex-specific prediction formulas. Br J Nutr . 1991; 65: 105– 114.
Jackson AS, Stanforth PR, Gagnon J, et al. The effect of sex, age and race on estimating percentage body fat from body mass index: the Heritage Family Study. Int J Obes Relat Metab Disord . 2002; 26: 789– 796.
Gallagher D, Heymsfield SB, Heo M, Jebb SA, Murgatroyd PR, Sakamoto Y. Healthy percentage body fat ranges: an approach for developing guidelines based on body mass index. Am J Clin Nutr . 2000; 72: 694– 701.
Sioka C, Fotopoulos A, Georgiou A, et al. Body composition in ambulatory patients with multiple sclerosis. J Clin Densitom . 2011; 14: 465– 470.
Wingo BC, Young HJ, Motl RW. Body composition differences between adults with multiple sclerosis and BMI-matched controls without MS. Disabil Health J . 2018; 11: 243– 248.
Weinstock-Guttman B, Gallagher E, Baier M, et al. Risk of bone loss in men with multiple sclerosis. Mult Scler . 2004; 10: 170– 175.
Formica CA, Cosman F, Nieves J, Herbert J, Lindsay R. Reduced bone mass and fat-free mass in women with multiple sclerosis: effects of ambulatory status and glucocorticoid use. Calcif Tissue Int . 1997; 61: 129– 133.
Silveira SL, Pilutti LA, Motl RW. No evidence of associations among body composition and symptoms in persons with multiple sclerosis. Rehabil Psychol . 2020; 65: 80– 86.
Hohol MJ, Orav EJ, Weiner HL. Disease steps in multiple sclerosis: a simple approach to evaluate disease progression. Neurology . 1995; 45: 251– 255.
Learmonth YC, Motl RW, Sandroff BM, Pula JH, Cadavid D. Validation of Patient Determined Disease Steps (PDDS) scale scores in persons with multiple sclerosis. BMC Neurol . 2013; 13: 37.
Tabachnick BG, Fidell LS. Using Multivariate Statistics . 7th ed. Pearson; 2019.
Bland JM, Altman DG. Measuring agreement in method comparison studies. Stat Methods Med Res . 1999; 8: 135– 160.
Gallagher D, Visser M, Sepúlveda D, Pierson RN, Harris T, Heymsfield SB. How useful is body mass index for comparison of body fatness across age, sex, and ethnic groups? Am J Epidemiol . 1996; 143: 228– 239.
Wells JCK. Sexual dimorphism of body composition. Best Pract Res Clin Endocrinol Metab . 2007; 21: 415– 430.
McArdle WD, Katch FI, Katch VL. Exercise Physiology: Nutrition, Energy, and Human Performance . 8th ed. Lippincott Williams & Wilkins; 2015.
Fogelholm M, Van Marken Lichtenbelt W. Comparison of body composition methods: a literature analysis. Eur J Clin Nutr . 1997; 51: 495– 503.
Motl RW, McAuley E, Snook EM. Physical activity and multiple sclerosis: a meta-analysis. Mult Scler . 2005; 11: 459– 463.
Snook EM, Mojtahedi MC, Evans EM, McAuley E, Motl RW. Physical activity and body composition among ambulatory individuals with multiple sclerosis. Int J MS Care . 2005; 7: 137– 142.
Pilutti LA, Dlugonski D, Sandroff BM, Klaren RE, Motl RW. Internetdelivered lifestyle physical activity intervention improves body composition in multiple sclerosis: preliminary evidence from a randomized controlled trial. Arch Phys Med Rehabil . 2014; 95: 1283– 1288.
Supplementary Material