

Publication
Research Article
International Journal of MS Care
Prediction of Driving Ability in People with Relapsing-Remitting Multiple Sclerosis Using the Stroke Driver Screening Assessment
The ability to drive is often affected in individuals with multiple sclerosis (MS) because of the motor, visual, or cognitive deficits commonly associated with the condition. In this study, we investigated the accuracy with which the Stroke Driver Screening Assessment (SDSA), an established battery for the prediction of driving performance of stroke survivors, would predict driving performance of individuals with MS. Driving performance of 44 individuals with relapsing-remitting MS (mean ± SD age, 46 ± 11 years; 37 females and 7 males) who were currently driving at least once a month was predicted using their performance on the SDSA. Outcomes of a road test and the Useful Field of View (UFOV) test were used as measures of driving ability. Participants' performance on both the road and UFOV tests was predicted with more than 80% accuracy. The SDSA was more accurate in predicting who would pass the two tests than who would fail the tests. The SDSA battery appears to be a good predictor of driving performance of individuals with relapsing-remitting MS, especially those who have sufficient cognitive skills to continue driving. Larger studies are needed to definitively establish its predictive accuracy and confirm the validity of the predictions.
Although the United States is a highly motorized developed country, access to public transportation is still far from ideal, especially in most rural areas. As a result, driving remains a critical part of everyday activity. The ability to drive is often compromised in individuals with multiple sclerosis (MS), who commonly experience motor, visual, and cognitive deficits.1–8 Several cognitive tests with varying capabilities to predict driving safety of individuals with MS have been identified in the literature.3–8 However, there is currently no consensus on either a short or a standardized battery of tests that can be used to accurately predict fitness to drive of individuals with MS in the United States. In one study, five cognitive tests that together predicted safety to drive in people with MS with 88% accuracy were identified.8 Three of the five tests are currently not used in the United States, while the remaining two are part of the Stroke Driver Screening Assessment (SDSA) battery, which was developed in the United Kingdom and has just been modified for use in the United States. The potential usefulness of the US version of the SDSA as a good predictor of driving after stroke was recently established.9 In this study, we investigated the hypothesis that the US version of the SDSA battery will predict driving performance of individuals with MS with at least 80% accuracy.
Methods
Participants
Participants were recruited through the Georgia Health Sciences University (GHSU) Multiple Sclerosis Center. Written informed consent was obtained in accordance with GHSU Human Assurance Committee requirements. Inclusion criteria were a neurologist-verified diagnosis of relapsing-remitting MS, age of 25 to 75 years, possession of a valid driver's license, at least 5 years of driving experience, having driven at least once a month in the last year, and having met minimum visual requirements to drive in accordance with Georgia laws (binocular visual acuity of ≥20/60 and peripheral vision of ≥140°).10 Other inclusion criteria were absence of substantive cognitive impairment or dementia (score of ≥24 on the Mini-Mental State Examination),11 being on a stable medication regimen (including steroids, benzodiazepines, or other cognition-altering medications), and a lack of exacerbation of symptoms within 1 month preceding and during the study. Individuals with traumatic brain injury, stroke, Parkinson's disease, acute psychiatric disorders, and drug or alcohol abuse were excluded.
Evaluations
Individuals who met all the inclusion and exclusion criteria were scheduled to visit the GHSU driving laboratory on different days. Information on the severity of the individual's disability (Expanded Disability Status Scale; EDSS),12 age, gender, driving experience, daily distance driven, physical functioning (Barthel Index),13 and cognition (Paced Auditory Serial Addition Test; PASAT)14 were collected during the visit. The SDSA and the Useful Field of View (UFOV) tests were then administered, with a road test scheduled within a week of the evaluations.
Stroke Driver Screening Assessment
The SDSA battery consists of four tests: the Dot Cancellation (DC), Square Matrix Direction (SMD), Square Matrix Compass (SMC), and Road Sign Recognition (RSR) tests. Together, they take approximately 30 minutes to administer.15 16 Modifications to the original version of the SDSA to make it suitable for use in the United States have been described recently.9 In the DC test, participants had to cross out all groups of four dots on a paper containing 625 groups of three, four, and five dots in a maximum time of 15 minutes. Documentation was made of time taken (range, 0–900 s); errors, consisting of groups of four dots uncrossed (range, 0–208); and false positives, consisting of groups of three and five dots crossed out (range, 0–412). Both the SMD and SMC tests involved correctly placing 16 cards, each containing pictures of two vehicles traveling in different directions, on 16 squares arranged in a four-by-four matrix. Each correctly placed card, determined by directional arrows (SMD test) or compass cards (SMC test) placed by the side of each square, earned two points. Participants had 5 minutes to complete each of the two tests. The RSR test involved placing the correct traffic sign from 19 available traffic signs on one of 12 traffic situations, depicted on cards placed in front of the participant, in a maximum time of 3 minutes. One point was given for each correctly placed traffic sign.
Useful Field of View
All participants were also administered the three-subtest computer-based touch screen version of the UFOV test.17 The three subtests tested speed of processing, divided attention, and selective attention skills. In the speed of processing subtest, participants were asked to indicate if it was a car or a truck that appeared in a box in the center of a 21-inch touch screen. The speed of presentation of the car or truck varied between 40 and 240 ms. The divided attention subtest evaluated the ability to attend to both central and peripheral visual stimuli simultaneously. Participants were instructed to identify the stimulus in the center of the screen (car or truck) and a second stimulus presented on a compass card at various degrees of radial angle (0° to 135° with 45° of inclination) and at different degrees of eccentricity (10°, 20°, or 30°). The third subtest tested selective attention skills in a way similar to the divided attention subtest, except that the peripheral stimulus was presented against a cluttered background consisting of triangles. Each subtest ended when the participant no longer identified two consecutively presented stimuli with 75% accuracy. Performance on all three subtests was calculated and a result in one of five categories was automatically generated by the test computer. Participants judged as having very low risk for accidents were categorized as 1, while those with very high risk were categorized as 5. Categories 1 and 2 were further classified as “pass” while categories 3, 4, and 5 were classified as “fail,” as in a previous study.18
Road Test
Participants' driving performance was evaluated on a standardized road course, also used for licensing novice drivers, in a vehicle adapted for safety (dual controls) and registered with the Georgia Department of Driver Services. The course traversed rural, urban, and interstate roadways and took approximately 45 minutes to complete. The test was administered by a certified driving instructor with over 33 years of experience in the assessment of older, disabled, and novice drivers. During the test, the instructor made short notes with which he completed a 16-item checklist immediately afterward. The checklist consisted of ten general driving behavior items (approaching traffic signs, checking blind spots, speeding, braking, lane maintenance, lane changing, staying in center of lane, following, signaling, and right of way) and six items that addressed the accuracy of execution of three left and three right turns. A score of 45 or more out of a maximum of 50 points was classified as “pass” (no major concerns) and other scores as “fail” (concerns with some aspects of driving), as during the real-life evaluation of individuals who have experienced a neurologic condition such as stroke, Parkinson's disease, and MS at the GHSU Driving Evaluation and Training facility. The instructor was blinded to participants' performance on all other tests administered.
Data Analysis
Clinical characteristics of participants who passed the road test were analyzed using descriptive statistics and compared with the data of those who failed the test. Similarly, the SDSA performance of those who passed the road test was compared with the performance of participants who failed. The discriminant equation of the original SDSA battery (UK version) was applied to the data to predict “pass” or “fail” performance on the road test (primary outcome measure) and UFOV test (another outcome measure). The discriminant equation is as follows:
Pass: (DC time × 0.038) + (DC error × 0.04) − (DC false positive × 0.335) + (SMD × 0.347) + (SMC × 0.495) + (RSR × 0.604) − 23.168
and
Fail: (DC time × 0.034) + (DC error × 0.031) − (DC false positive × 0.258) + (SMD × 0.403) + (SMS × 0.428) + (RSR × 0.229) − 19.615
When a participant's “pass” score is higher than the “fail” score, that individual is predicted to pass, and vice versa.
We also performed a discriminant analysis using our data to explore whether a more accurate prediction equation that will better predict participants' “pass” or “fail” performance on the road test can be obtained. For this purpose, a rank biserial correlation analysis between all SDSA variables and the “pass” or “fail” outcome on the road test was performed. Only variables that were significantly associated (P < .05) with the outcome and not intercorrelated were entered into a univariate regression analysis. Subsequently, only variables that had individual predictive values of the performance on the road test and with a P value not greater than .20 were entered into a discriminant analysis to derive the new equation. All statistical analyses were performed using SAS software, version 9.2 (SAS Institute, Inc, Cary, NC).
Results
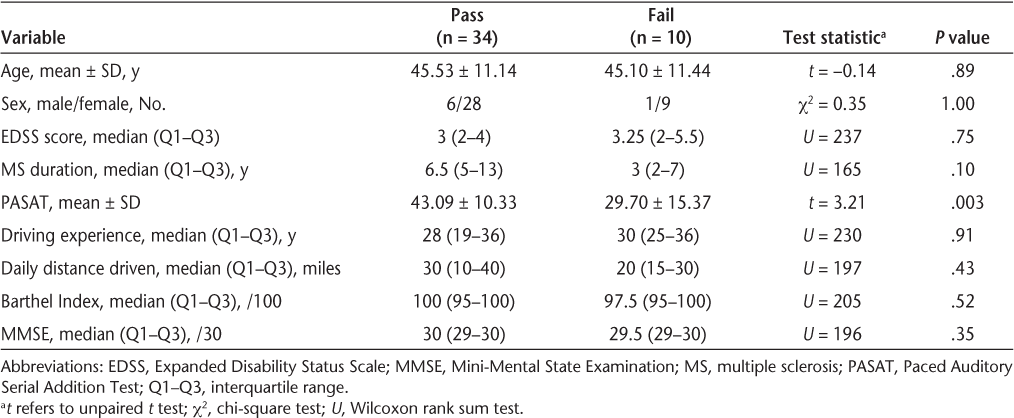
Forty-nine of 50 enrolled participants were evaluated in the GHSU driving laboratory, because one participant chose not to continue in the study after giving consent. Before the road test, one participant relapsed and four opted out of the study out of concern about potential legal implications of failing the road test despite being informed during the consent process that there were no such implications. As a result, data from 44 participants (mean ± SD age, 46 ± 11 years; 37 females and 7 males) with a diagnosis of relapsing-remitting MS (median duration, 6.5 years) were analyzed. As shown in Table 1, most of the clinical characteristics—including severity of disability (EDSS), driving experience, and physical functioning (Barthel Index)—were similar in those who passed the road test and those who failed the test. Only cognition, as measured using the PASAT, was significantly better in those who passed the road test.


Comparison of clinical characteristics of study participants who passed versus those who failed the road test
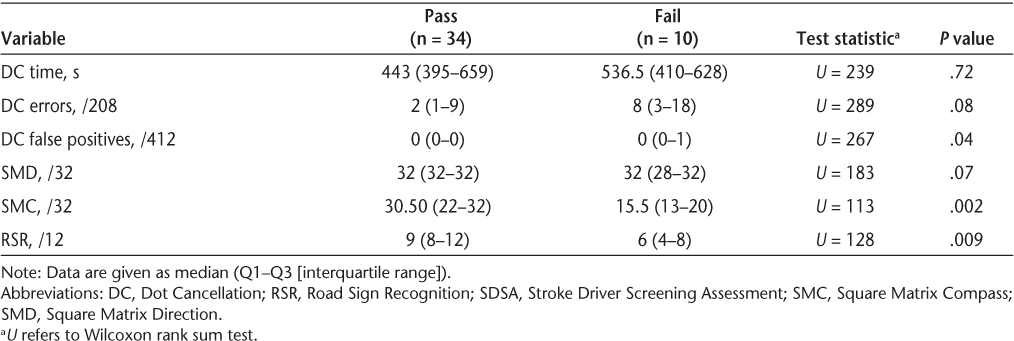
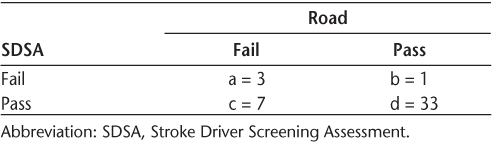
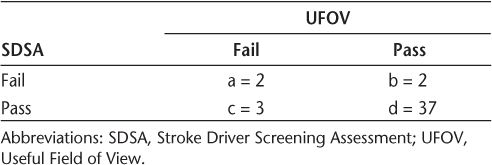
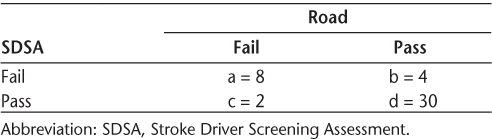
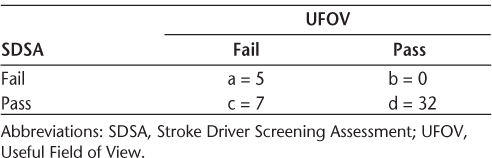
Participants who passed the road test committed no false-positive error on the DC test and also performed significantly better on the SMC and RSR tests of the SDSA battery than those who failed the road test (Table 2). Using the original equation based on the UK version of the SDSA, participants' performance on the road test was predicted with 82% accuracy, 30% sensitivity, and 97% specificity (Table 3A) and their UFOV performance with 89% accuracy, 40% sensitivity, and 95% specificity (Table 3B).


Comparison of SDSA performance of participants who passed versus those who failed the road test


Numbers of participants who failed and passed: SDSA versus Road


Numbers of participants who failed and passed: SDSA versus UFOV
Only the DC false positive (r = –0.34, P = .03), SMD (r = 0.38, P = .01), SMC (r = 0.57, P < .0001), and RSR (r = 0.47, P = .0012) were significantly associated with the “pass” or “fail” outcome of the road test. None of these variables were intercorrelated, and as a result all were entered into the univariate regression analysis. Each of the variables had individual predictive values and P < .20 (DC false positive: R 2 = 0.16, P = .16; SMD: R 2 = 0.17, P = .08; SMC: R 2 = 0.42, P < .0026; RSR: R 2 = 0.31, P = .007). The discriminant equation based on the four SDSA variables is as follows:
Pass: (DC false positive × 7.0912) + (SMD × 1.6134) + (SMC × 0.5737) + (RSR × 0.3042) – 35.0186
and
Fail: (DC false positive × 7.1088) + (SMD × 1.5555) + (SMC × 0.3784) + (RSR × 0.0397) – 26.9649
This equation predicted participants' road performance with 86% accuracy, 80% sensitivity, and 88% specificity (Table 3C) and their UFOV performance with 84% accuracy, 42% sensitivity, and 100% specificity (Table 3D).


Numbers of participants who failed and passed: SDSA (study sample–based equation) versus Road


Numbers of participants who failed and passed: SDSA (study sample–based equation) versus UFOV
Discussion
In this study, the main measure of driving ability was performance on a standardized road test. Since all participants were physically functional (Barthel Index >75) and met state-prescribed visual requirements for driving, it is not surprising that only cognitive skills relevant to driving, as measured using the PASAT and the SMC and RSR tests of the SDSA, distinguished between participants who passed and those who failed the road test. Although the road test is still regarded by many driving assessment experts and researchers as the closest approximation to real-life driving,19 the use of performance on the road test as the sole criterion of driving ability remains controversial because of reliability and validity concerns. Thus, we used performance on the UFOV test, a reliable and valid predictor of crash risk in older drivers and in different neurologic populations,18 as an additional measure of participants' driving ability. The SDSA, irrespective of the discriminant equation applied, predicted performance on both the road test and the UFOV test with very high (>80%) accuracy. The SDSA has not previously been shown to be a good stand-alone predictor of driving in neurologic conditions other than stroke.8 20 21 The SDSA battery measures visual attention, mental speed, recognition, and executive abilities that are relevant to driving.15 16 The SDSA was originally developed in the United Kingdom and has been modified for use in other countries, including the United States.9 15 16 22 23 The reliability and validity of the different versions of the battery as a good predictor of driving performance after stroke have been established.16 18 24 25
The accuracy and sensitivity of predicting the road performance (the main outcome measure) using the equation based on the study sample (86% and 80%, respectively) were better than those of the prediction based on the UK version (82% and 30%). This is also not surprising, because the data used for developing the study sample–based equation and the performance predicted are from the same sample. The sensitivity and specificity of predicting performance on the UFOV test using the sample-based equation (42% and 100%, respectively) were also better than those of the UK version (40% and 95%), probably for the same reason. In all cases, the specificity of the predictions was better than the sensitivity, an indication that the SDSA is stronger at accurately identifying those who have sufficient cognitive skills to keep driving than it is at identifying those who do not. Similar results were found in a study that applied the discriminant equation derived from the data of a Nordic sample of stroke survivors to predict the road performance of stroke survivors in Sweden and Norway.22 It therefore seems advisable to use the equation derived using data from the population in the country in which the test is administered (in this case, the discriminant equation based on the study sample) to obtain more accurate predictions. Clinically, the raw score of patients' performance on each test of the SDSA is used to replace the name of the test in the discriminant equation, and the totals for the “pass” and “fail” equations are calculated. If the “pass” score is higher than the “fail” score, that individual is predicted to pass, and vice versa.
Further data examination showed that the difference between the “pass” and “fail” SDSA values (study sample–based equation) of the participants who were incorrectly predicted to pass or fail either the road test or the UFOV test was 2 or less. Other evaluations are thus warranted in cases where the difference between the “pass” and “fail” numerical values on the SDSA is 2 or less. Key limitations of this study include sample size and nonuse of an independent sample of individuals with MS to determine the validity of the predictive accuracy of the SDSA. Larger studies are therefore needed to definitively establish the predictive accuracy of the SDSA and its validity as a measure of driving ability of individuals with MS.
PracticePoints
There is currently no short battery of tests to accurately screen individuals with MS for fitness to continue driving.
The Stroke Driver Screening Assessment (SDSA) battery, which consists of four tests that together take approximately 30 minutes to administer, predicted the driving performance of individuals with relapsing-remitting MS with very good accuracy.
MS clinicians can administer the SDSA to help identify patients whose cognitive skills may make driving unsafe and who would benefit from a comprehensive driving evaluation.
Acknowledgments
This study was supported by a pilot study grant from the Consortium of Multiple Sclerosis Centers. The authors also acknowledge the contributions of Sola Fasusi, MD, Lara Stepleman, PhD, Rhonda Casillas, PhD, Rebecca Rahn, PA-C, Kelly Baker, BS, Michelle Hoogstra, BS, and Kendra Philips, BS, during data acquisition.
References
Lings S. Driving accident frequency increased in patients with multiple sclerosis. Acta Neurol Scand. 2002; 105: 169–173.
Schultheis MT, Garay E, Millis SR, DeLuca J. Motor vehicle crashes and violations among drivers with multiple sclerosis. Arch Phys Med Rehabil. 2002; 83: 1175–1178.
Schultheis MT, Garay E, DeLuca J. The influence of cognitive impairment on driving performance in multiple sclerosis. Neurology. 2001; 56: 1089–1094.
Shawaryn MA, Schultheis MT, Garay E, DeLuca J. Assessing functional status: exploring the relationship between the Multiple Sclerosis Functional Composite and driving. Arch Phys Med Rehabil. 2002; 83: 1123–1129.
Kotterba S, Orth M, Eren E, Fangera T, Sindern E. Assessment of driving performance in patients with relapsing-remitting multiple sclerosis by a driving simulator. Eur J Neurol. 2003; 50: 160–164.
Marcotte TD, Rosenthal TJ, Roberts E, et al. The contribution of cognition and spasticity to driving performance in multiple sclerosis. Arch Phys Med Rehabil. 2008; 89: 1753–1758.
Schultheis MT, Manning K, Weisser V, Blasco A, Ang J, Wilkinson ME. Vision and driving in multiple sclerosis. Arch Phys Med Rehabil. 2010; 91: 315–317.
Lincoln NB, Radford KA. Cognitive abilities as predictors of safety to drive in people with multiple sclerosis. Mult Scler. 2008; 14: 123–128.
Akinwuntan AE, Gantt D, Gibson G, et al. The United States version of the Stroke Driver Screening Assessment: a pilot study. Top Stroke Rehabil. In press.
State of Georgia, USA, Licensing Requirements. http://www.nhtsa.dot.gov/people/injury/olddrive/OlderDriversBook/pages/Georgia.htm. Accessed January 10, 2012.
Folstein MF, Folstein SE, McHugh PR. Mini-Mental State: a practical method for grading the cognitive state of patients for the clinician. J Psychiatr Res. 1975; 12: 189–198.
Kurtzke JF. Rating neurologic impairment in multiple sclerosis: an expanded disability status scale (EDSS). Neurology. 1983; 33: 1444–1452.
Mahoney FI, Barthel D. Functional evaluation: the Barthel Index. Maryland State Medical Journal. 1965; 14: 56–61.
Fischer JS, Rudick RA, Cutter GR, Reingold SC; National MS Society Clinical Outcomes Assessment Task Force. The Multiple Sclerosis Functional Composite Measure (MSFC): an integrated approach to MS clinical outcome assessment. Mult Scler. 1999; 5: 244–250.
Nouri FM, Lincoln NB. Validation of a cognitive assessment: predicting driving performance after stroke. Clin Rehabil. 1992; 6: 275–281.
Nouri FM, Lincoln NB. Predicting driving performance after stroke. BMJ. 1993; 307: 482–483.
Ball K, Owsley C. The useful field of view test: a new technique for evaluating age-related declines in visual function. J Am Optom Assoc. 1993; 64: 71–79.
George S, Crotty M. Establishing criterion validity of the Useful Field of View assessment and Stroke Driver's Screening Assessment: comparison to the results of on-road assessment. Am J Occup Ther. 2010; 64: 114–122.
Korner-Bitensky N, Bitensky J, Sofer S, Man-Son-Hing M, Gelinas I. Driving evaluation practices of clinicians working in the United States and Canada. Am J Occup Ther. 2006; 60: 428–434.
Radford KA, Lincoln NB, Lennox G. The effects of cognitive abilities on driving in people with Parkinson's disease. Disabil Rehabil. 2004; 26: 65–70.
Lincoln NB, Radford KA, Lee E, Reay AC. The assessment of fitness to drive in people with dementia. Int J Geriatr Psych. 2006; 21: 1044–1051.
Lundberg C, Caneman G, Samuelsson S, Hakamies-Blomqvist L, Almkvist O. The assessment of fitness to drive after a stroke: the Nordic Stroke Driver Screening Assessment. Scan J Psychol. 2003; 44: 23–30.
Selander H, Johansson K, Lundberg C, Falkmer T. The Nordic stroke driver screening assessment as predictor for the outcome of an on-road test. Scand J Occup Ther. 2010; 17: 10–17.
Radford KA, Lincoln NB. Concurrent validity of the Stroke Drivers Screening Assessment. Arch Phys Med Rehabil. 2004; 85: 324–328.
Radford KA, Lincoln NB, Murray-Leslie C. Validation of the stroke driver screening assessment for people with traumatic brain injury. Brain Injury. 2004; 18: 775–786.
Financial Disclosures: The authors have no conflicts of interest to disclose.
Equipment Resources