Publication
Research Article
International Journal of MS Care
Individual and Co-occurring SNAP Risk Factors
Background: Smoking, poor nutrition, excess alcohol consumption, and insufficient physical activity underlie most preventable causes of morbidity in the general population and may be associated with comorbidities and health outcomes in multiple sclerosis (MS). However, the frequency of co-occurrence of these risk factors in people with MS remains unclear.
Methods: Sixty-nine individuals with MS completed self-report measures of smoking status, nutrition, alcohol use, physical activity levels, and sociodemographic and clinical characteristics. The data were analyzed using t tests and χ2 analyses.
Results: Poor diet was the most common risk factor, with 85.5% of the sample not meeting dietary guidelines. Of participants with two risk factors, 90.3% were not meeting dietary and physical activity guidelines. Seventy-three percent of women were not meeting physical activity guidelines, compared with 38% of men (χ2 = 7.5, P < .01). There were also differential rates by sex of the most commonly co-occurring risk factors: 65% of women reported the co-occurrence of insufficient physical activity and poor diet, compared with 38% of men (χ2 = 4.2, P = .05).
Conclusions: These results indicate that 85.5% of the sample was not meeting nutrition guidelines, 90.3% of participants with two risk factors reported the co-occurrence of poor diet and insufficient levels of physical activity, and physical activity levels and the total number of risk factors varied across sex.
Multiple sclerosis (MS) is a chronic, immune-mediated disease of the central nervous system with a prevalence of 1 per 1000 people in the United States.1 The disease presents with a range and severity of symptoms, including loss of walking mobility, cognitive dysfunction, fatigue, and depression. There is additional evidence for the occurrence of comorbidities (eg, hypertension, hyperlipidemia, and chronic lung disease) in people with MS, and comorbidities seemingly result in diagnostic delays and disability progression.2 Smoking, poor nutrition, excess alcohol consumption, and insufficient physical activity, known as the SNAP risk factors, underlie most preventable causes of morbidity in the general population.3 However, the frequency of co-occurrence of SNAP risk factors in people with MS remains unclear.
The four aforementioned and often co-occurring SNAP risk factors have been a consistent focus of health behavior research in adults from the general population.4,5 One systematic review examined the patterns of co-occurring SNAP risk factors in adults from the general population in 56 studies that included two or more SNAP risk factors.3 Common patterns of risk factor co-occurrence included a “healthy” group that reported no risk factors; this occurred in more than 80% of the 56 studies. There was a group reporting all four risk factors, and this occurred in 50% of the 56 studies. Approximately 45% of the studies reported poor diet co-occurring with low levels of physical activity. The presence of co-occurring SNAP risk factors was most common in men and those with lower levels of education and was also prevalent in those with lower socioeconomic status and younger age.
There has been some focus on SNAP risk factors in people with MS, but these often have been examined individually across separate research studies. These studies yield information about the individual SNAP risk factors but not a pattern of co-occurring SNAP risk factors. For example, cross-sectional studies have reported that 13% to 40% of people with MS screened positive for possible alcohol abuse or dependence.6–8 One study examined smoking rates in 350 individuals with MS and reported current smoking in 15.2%.9 Participants who were current smokers reported heavier smoking (20–30 cigarettes daily) and smoking for 10 years or longer. Regarding nutritional behaviors, one cross-sectional analysis of people with MS reported that less than half of the participants (47.5%) engaged in healthy nutritional behaviors.10 Participants consumed less than the recommended levels of carbohydrates, fiber, vitamin E, calcium, and zinc but greater amounts of saturated fat, protein, vitamins A and C, folic acid, and iron. However, the authors did not conduct food-level analyses. One recent examination of physical activity rates in people with MS reported that 58% of those with MS engaged in insufficient levels of physical activity.11
In one study that reported on multiple SNAP risk factors in the same sample of people with MS, of 8983 participants, 17.3% self-identified as current smokers, 18.2% were at risk for alcohol abuse or dependence, and less than 25% reported regular participation in moderate or heavy leisure-time physical activity.12 Lower socioeconomic status correlated with a higher frequency of adverse health behaviors. Participants with lower educational and income levels were more likely to smoke. Women, participants older than 50 years, and those with lower levels of income had a lower risk of excess alcohol consumption. Lower levels of education and higher levels of disability were associated with less vigorous physical activity. That study did not include nutrition and did not provide descriptive data on the patterns, distribution, and correlates of co-occurring SNAP risk factors.
To date, we are unaware of research that has formally examined the individual and co-occurring SNAP risk factors (ie, smoking, poor nutrition, excess alcohol consumption, and insufficient physical activity levels) in individuals with MS. The study of co-occurring health behaviors in a population is a way to assess groups whose lifestyles put them at greater risk for future illness and to inform the design of tailored interventions.13 Consequently, there is increasing interest in studying the individual and co-occurrence of SNAP risk factors in people with MS.12 Accordingly, this study examined 1) the occurrence of individual SNAP risk factors in people with MS, 2) the prevalence and patterns of co-occurring SNAP risk factors, and 3) individual and co-occurring SNAP risk factor variations across sociodemographic and clinical characteristics. Such inquiry could inform future research targeting multiple health behaviors and holistic health interventions in MS.
Methods
Participants
Recruitment included advertising through the National Multiple Sclerosis Society Local Research Studies webpage, posting on the Exercise Neuroscience Research Laboratory Facebook page, and contacting individuals in our laboratory database. The advertisement described a study on multiple risk factors in MS. The inclusion criteria were 1) age 18 to 64 years, 2) relapse free in the past 30 days, 3) ambulatory with or without assistance, and 4) not pregnant (pregnancy can affect health behaviors). Of the 92 individuals with MS who underwent screening, 8 were disqualified, 14 were qualified but declined to participate before testing due to scheduling issues, and 70 met the inclusion criteria and were scheduled for testing. One participant declined to provide self-report information, resulting in a final convenience sample of 69 individuals with MS.
Measures and Definitions of Risk Factors
Smoking status was assessed using the Centers for Disease Control and Prevention's Tobacco Use Questionnaire.14 Participants were asked, “Have you smoked at least 100 cigarettes in your entire lifetime?” and, if yes, “Do you now smoke cigarettes every day, some days, or not at all?” Participants were then categorized as smokers if they currently smoked every day or some days and as nonsmokers if they have never smoked 100 cigarettes or no longer did. Smoking was considered a risk factor.
Inadequate fruit/vegetable and whole grain consumption was used as an index of poor nutrition. Participants completed a 3-day food record for 2 weekdays and 1 weekend day. Participants were instructed to record all foods and beverages consumed. On completion of the food record, a registered dietitian reviewed each meal with participants to ensure that portion sizes, use of condiments, additional ingredients, and so on were recorded accurately. Inadequate fruit/vegetable consumption was defined as not meeting the fruit and vegetable guidelines outlined by the US Department of Agriculture and MyPlate.gov.15
Recommendations are specific to age and sex. For example, women aged 31 to 50 years should aim for a minimum of 2.5 cups of vegetables and 1.5 cups of fruit per day; men aged 31 to 50 years should aim for a minimum of 3 cups of vegetables and 2 cups of fruit per day. Inadequate whole grain consumption was defined as not meeting the whole grain recommendation outlined by the US Department of Agriculture and MyPlate.gov (eg, half or more of all grains should be whole).16 Not meeting the guidelines for fruit/vegetable and whole grain intake was considered a risk factor. The Nutrition Data System for Research nutritional analysis software (Nutrition Coordinating Center, Minneapolis, MN) was used to analyze dietary intake.
Excess alcohol consumption was also assessed using the 3-day food record. A score of 2 or more standard drinks per day for men and 1 or more standard drinks per day for women exceeds health recommendations. Participants were categorized as meeting the guidelines or not; exceeding the guidelines was considered a risk factor.15 Physical activity levels were assessed using the Godin Leisure-Time Exercise Questionnaire (GLTEQ).17 The GLTEQ includes three items that measure the frequency of mild, moderate, and strenuous physical activities that occur for at least 15 minutes during a person's leisure time. The frequencies of vigorous and moderate activities were multiplied by 9 and 5 metabolic equivalents, respectively, and then were summed as a health contribution score.18 Participants accumulating 24 units or more were classified as active and meeting the guidelines, and those accumulating 23 units or less were considered insufficiently active and not meeting the guidelines; not meeting the guidelines was considered a risk factor. The cutoff score for the GLTEQ was defined so that it aligns with the recommendations for physical activity formulated by the Surgeon General of the United States. The cutoff score of 24 for the GLTEQ also accounts for weekly frequency and energy expenditure according to the American College of Sports Medicine physical activity guidelines.19 These guidelines seemingly correspond with rates of physical activity in MS classified based on accelerometry and have been validated in healthy adults.11,18,19
Procedures
This study was approved by the University of Illinois at Urbana-Champaign institutional review board, and participants provided written informed consent. Participants underwent a neurologic evaluation by a Neurostatus-certified examiner for generation of an Expanded Disability Status Scale score, had their height and weight measured, and then completed self-report measures of smoking status, diet, alcohol use, physical activity levels, and sociodemographic and clinical characteristics. Participants were remunerated for their time.
Statistical Analyses
Statistical analyses were performed using IBM SPSS Statistics for Windows (version 22; IBM Corp, Armonk, NY). Characteristics of the sample are presented as frequencies and percentages, unless otherwise noted. We present the percentage of participants reporting each individual SNAP risk factor for the sample, the percentage of the population with multiple SNAP risk factors (ie, the occurrence of SNAP risk factors summed per participant), and the SNAP risk factor distribution (ie, the percentage of the population not meeting guidelines across all possible patterns of SNAP risk factors). We compared the distribution of individual SNAP risk factors between sociodemographic and clinical factors using χ2 analysis. We report the median (interquartile range [IQR]) values of SNAP risk factors for important sociodemographic and clinical factors. In addition, we examined variations in the total number of risk factors (summed total number of SNAP risk factors) between clinical and demographic characteristics using nonparametric t tests. The magnitude of the z statistics was interpreted as small, medium, and large based on values of 0.1, 0.3, and 0.5, respectively.20 Exploratory analyses of the most commonly co-occurring risk factors were performed using χ2 analysis.
Results
Sociodemographic and Clinical Characteristics
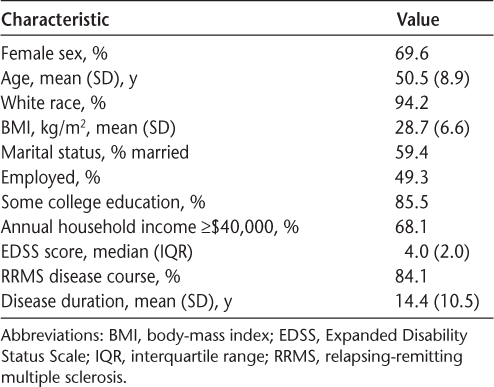
The 69 participants were primarily female (69.6%), white (94.2%), and married (59.4%) (Table 1). Nearly half of the participants were employed (49.3%), 85.5% had some college education, and 68.1% had an annual household income of $40,000 or more. The mean (SD) age was 50.5 (8.9) years. The mean (SD) body-mass index (BMI; calculated as weight in kilograms divided by height in meters squared) was 28.7 (6.6). Participants primarily had relapsing-remitting MS (84.1%), mild-to-moderate disability (median [IQR] Expanded Disability Status Scale score, 4.0 [2.0]), and a mean (SD) disease duration of 14.4 (10.5) years.


Sociodemographic and clinical characteristics of 69 individuals with multiple sclerosis
Occurrence of Individual SNAP Risk Factors
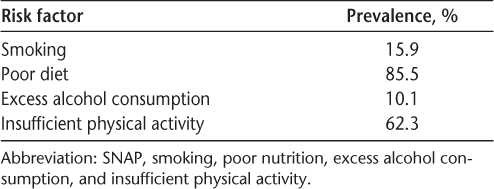
Poor diet was the most common SNAP risk factor, with 85.5% of the sample not meeting dietary guidelines for fruit/vegetable (95.7%) and whole grain (87.0%) consumption (Table 2). Insufficient physical activity was the second most prevalent SNAP risk factor, with 62.3% of the sample not meeting physical activity guidelines for moderate-vigorous physical activity.


Occurrence of individual SNAP risk factors in 69 individuals with multiple sclerosis
Co-occurring SNAP Risk Factors
As displayed in Table 3, 34.8% of the sample had one SNAP risk factor and 59.4% had two or three co-occurring risk factors. Only 5.7% of the participants had zero or four SNAP risk factors. Table 3 further presents all possible patterns of individual and co-occurring SNAP risk factors. The median number of SNAP risk factors reported was two (IQR = 1). Of participants with one SNAP risk factor, 70.8% were not meeting dietary guidelines for fruit/vegetable and whole grain consumption. Of participants with two SNAP risk factors, 90.3% were not meeting dietary and physical activity guidelines. Smoking occurred only in participants who reported insufficient levels of physical activity and/or poor diet (91% of participants reporting three or more SNAP risk factors).


Prevalence and patterns of co-occurring SNAP risk factors

Variation in Individual and Total Number of SNAP Risk Factors
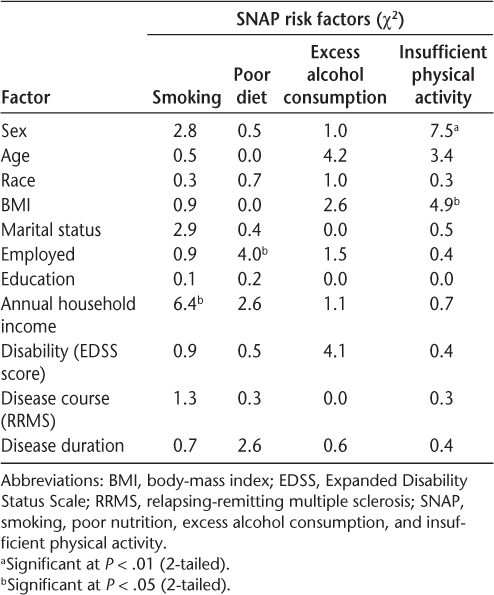
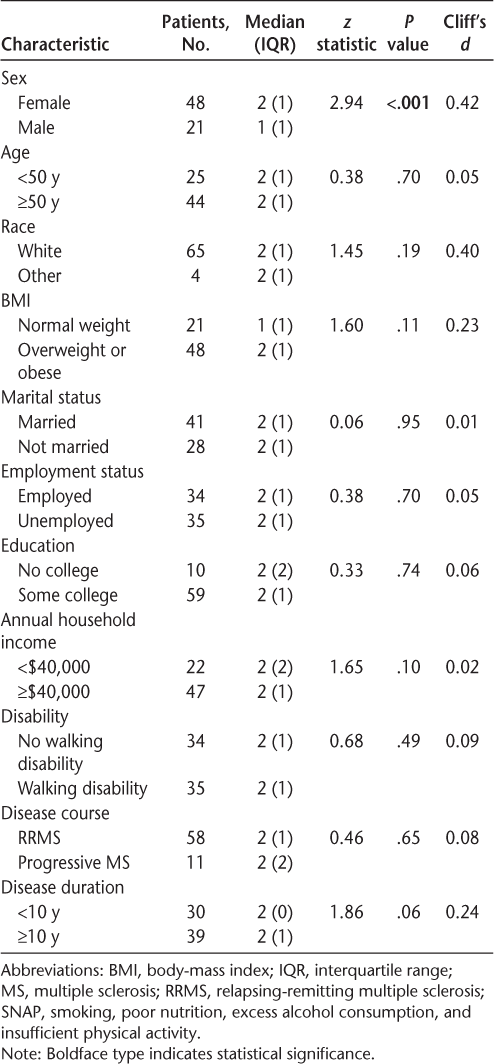
Results of the χ2 analyses are reported in Table 4. Analyses of individual risk factors between sociodemographic and clinical characteristics revealed differential rates of meeting physical activity guidelines between men and women (χ2 = 7.5, P < .01), with 73% of women not meeting physical activity guidelines, compared with 38% of men. Rates of meeting dietary guidelines varied by employment status, with 94% of employed individuals not meeting dietary guidelines, compared with 77% of unemployed individuals. Rates of meeting physical activity guidelines varied by BMI (χ2 = 4.9, P < .05), with 70% of overweight and obese individuals not meeting physical activity guidelines, compared with 42% of individuals with a healthy weight. Smoking status was differential across household income (χ2 = 6.4, P < .05), with 33% of individuals earning less than $40,000 per year having this risk factor, compared with 8% of individuals earning $40,000 or more per year. Nonparametric t-test analyses assessing the variation of the total number of risk factors between sociodemographic and clinical characteristics revealed a significant difference between men and women (z = 2.94, P < .001), with women reporting a higher total number of risk factors (Table 5). No other sociodemographic or clinical characteristics were statistically significantly different.


Variation in individual SNAP risk factors by clinical and sociodemographic factors


Variation in total number of co-occurring SNAP risk factors by clinical and sociodemographic characteristics
Exploratory χ2 analyses assessing the variation of the co-occurrence of insufficient physical activity and poor diet—the most common pair of co-occurring SNAP risk factors—revealed a differential relationship between the sexes (χ2 = 4.2, P < .05), with 65% of women reporting the co-occurrence of insufficient physical activity and poor diet, compared with 38% of men. The co-occurrence of physical activity and poor diet also varied across BMI (χ2 = 4.1, P < .05), with 65% of overweight and obese individuals reporting the co-occurrence, compared with 38% of individuals with a healthy weight.
Discussion
The present study involved a novel investigation of the individual and co-occurrence of SNAP risk factors and the variations across clinical and sociodemographic characteristics in people with MS. Overall, the results indicated that 1) an overwhelming 85.5% of the sample was not meeting nutrition guidelines independent of other SNAP risk factors, 2) 90.3% of participants with two risk factors reported the co-occurrence of poor diet and insufficient levels of physical activity, and 3) physical activity levels and the total number of SNAP risk factors varied by sex. These findings collectively suggest that people with MS do, indeed, report the individual and co-occurrence of SNAP risk factors and that poor diet and insufficient levels of physical activity are the most commonly reported co-occurring SNAP risk factors in this population. This study also indicates that MS subpopulations, specifically women, are more susceptible to the individual and co-occurrence of SNAP risk factors. Future research is needed to investigate the consequences of the individual and co-occurring SNAP risk factors as well as to reduce SNAP risk factors in MS through multiple health behavior change interventions.
Poor diet was the most commonly reported SNAP risk factor, with 85.5% of the sample not meeting dietary guidelines for fruit/vegetable and whole grain consumption. The nutritional habits of people with MS have not been well studied; however, this study suggests that individuals with MS have nutritional habits comparable to or worse than those of the general population.21 A recent Centers for Disease Control and Prevention report estimated that only 13.1% of healthy adults in the United States are meeting fruit intake recommendations and 8.9% are meeting vegetable intake recommendations.22 A diet rich in fruits and vegetables may help reduce the risk of heart disease, certain types of cancer, obesity, and type 2 diabetes.16 A recent study reported that less than 1% of healthy adults met whole grain recommendations in 2011–2012.23 The regular consumption of whole grains as a means of obtaining adequate dietary fiber has been associated with improved cardiovascular health, glycemic control, and weight management.24 Improved nutritional behaviors should be considered as a focus for effectively managing overall health and comorbidities in people with MS. Indeed, one study examining the correlates of nutritional behavior in individuals with MS reported that nutritional self-efficacy (β = 0.69, P < .001) was the strongest predictor of nutritional behaviors. These data support the development of future interventions to improve health behaviors in people with MS.
More than half the sample (60.9%) reported two or more co-occurring SNAP risk factors. Importantly, 90.3% of participants reported the co-occurrence of poor diet and insufficient levels of physical activity. Moreover, exploratory analyses suggested variance of the co-occurrence of these two risk factors across sex and BMI. This co-occurrence is similar to the clustering of “energy balance behaviors of physical activity and diet” seen in the general population.4 Future investigations of co-occurring SNAP risk factors should specifically examine the co-occurrence and correlates and consequences of insufficient physical activity and poor diet to inform the design of multiple health behavior change interventions in MS. There is evidence that the two behaviors may predict one another, further suggesting that targeting the co-occurring risk factors in a multiple health behavior change intervention could be more effective than targeting the risk factors separately.25
Smoking was reported by 15.9% of participants. This is comparable with previous investigations of smoking in people with MS wherein 15.2% of participants reported smoking.9 Excess alcohol consumption was reported by 10.1% of the sample, which is lower than the 13% to 40% of participants who screened positive for possible alcohol abuse or dependence in other investigations.6 – 8 The two risk factors did not often co-occur (only the 1.4% of the sample reporting all four SNAP risk factors reported smoking and excess alcohol consumption together). This low co-occurrence is different from examinations of co-occurring risk factors in the general population that have reported a clustering of addictive behaviors, such as smoking and excess alcohol consumption.4 It is possible that underreporting from study participants resulted in lower reported rates of smoking and alcohol consumption; perhaps persons with disabling conditions are more prone to underreporting smoking and alcohol consumption than the general population. It is also possible that sampling bias leading to underrepresentation of individuals with addictive behaviors resulted in lower reported rates. This might have been associated with advertising the study as an examination of multiple risk factors in MS, not smoking or alcohol consumption specifically. Future investigations are needed to understand the nature of smoking and alcohol consumption in people with MS and the possible relationship with co-occurring insufficient physical activity levels and poor diet.
Physical activity levels and the total number of SNAP risk factors varied by sex. Women reported a higher number of SNAP risk factors and were less physically active than men. This finding is important because it identifies a subpopulation of people with MS (women) who are more susceptible to co-occurring SNAP risk factors. Moreover, we know that MS affects thrice as many women as men. This finding confirms the need for more investigations of the co-occurrence of SNAP risk factors, particularly in women with MS. Note that there is evidence of sex differences in social desirability in self-report measures; women are more likely to respond to self-report measures in a socially desirable manner.26,27 Therefore, it is possible that the variation across sex observed in the present study may be underestimated because women could be underreporting overall SNAP risk factors and overreporting more physical activity participation to comply with social norms. We do note that the GLTEQ as a measure of physical activity is fairly robust against social desirability.28
There are important limitations of the present study. The sample of individuals with MS was relatively homogeneous, consisting of primarily white and female patients. The sample included mostly participants with relapsing-remitting MS and was characterized by moderate disability. Therefore, these results may not be generalizable to those with other types of MS, those with more severe disability status, or men. In addition, this study included self-report measures, which are subject to recall and social desirability reporting biases. This exploratory study had a relatively small sample, and future research should examine SNAP risk factors in a larger, heterogeneous sample of individuals with MS, particularly in those with higher disability levels and progressive forms of the disease.
The present study provides preliminary evidence of the individual and co-occurrence of SNAP risk factors in MS. This evidence suggests that people with MS are far from meeting physical activity and diet guidelines for health benefits and that women are particularly susceptible. Such evidence supports additional examinations of the correlates of and interventions for individual and co-occurring SNAP risk factors, specifically diet and physical activity levels, in people with MS.
PracticePoints
The great majority of the sample of people with MS were not meeting nutrition guidelines for fruit/vegetable and whole grain consumption.
More than half of the sample reported two or more co-occurring risk factors; 90.3% of participants with two risk factors reported the co-occurrence of poor diet and insufficient levels of physical activity.
More women than men reported not meeting physical activity guidelines and the co-occurrence of poor diet and insufficient levels of physical activity.
References
Page WF, Durtzke JF, Murphy FM, Norman JE. Epidemiology of multiple sclerosis in U.S. veterans, V: ancestry and the risk of multiple sclerosis. Ann Neurol. 1993;33:632–639.
Marrie RA, Cohen J, Stuve O, et al. A systematic review of the incidence and prevalence of comorbidity in multiple sclerosis: overview. Mult Scler J. 2015;21:263–281.
Noble N, Paul C, Turon H, Oldmeadow C. Which modifiable health risk behaviours are related? a systematic review of the clustering of smoking, nutrition, alcohol and physical activity (‘SNAP’) health risk factors. Prev Med. 2015;81:16–41.
Prochaska JJ, Prochaska JO. A review of multiple health behavior change interventions for primary prevention. Am J Lifestyle Med. 2011;5(3).
Berrigan D, Dodd K, Troiano RP, Krebs-Smith SM, Barbash RB. Patterns of health behavior in U.S. adults. Prev Med. 2003;36:615–623.
Bombardier CH, Blake KD, Ehde DM, Gibbons LE, Moore D, Kraft GH. Alcohol and drug abuse among persons with multiple sclerosis. Mult Scler Houndmills Basingstoke Engl. 2004;10:35–40.
Turner AP, Hawkins EJ, Haselkorn JK, Kivlahan DR. Alcohol misuse and multiple sclerosis. Arch Phys Med Rehabil. 2009;90:842–848.
Beier M, D'Orio V, Spat J, Shuman M, Foley FW. Alcohol and substance use in multiple sclerosis. J Neurol Sci. 2014;338:122–127.
Friend KB, Mernoff ST, Block P, Reeve G. Smoking rates and smoking cessation among individuals with multiple sclerosis. Disabil Rehabil. 2006;28:1135–1141.
Timmerman GM, Stuifbergin AK. Eating patterns in women with multiple sclerosis. J Neurosci Nurs J Am Assoc Neurosci Nurses. 1999;31:152–158.
Motl RW, McAuley E, Sandroff BM, Hubbard EA. Descriptive epidemiology of physical activity rates in multiple sclerosis. Acta Neurol Scand. 2015;131:422–425.
Marrie RA, Horwitz R, Cutter G, Tyry T, Campagnolo D, Vollmer T. High frequency of adverse health behaviors in multiple sclerosis. Mult Scler. 2009;15:105–113.
Griffin B, Sherman KA, Jones M, Bayl-Smith P. The clustering of health behaviours in older Australians and its association with physical and psychological status, and sociodemographic indicators. Ann Behav Med. 2014;48:205–214.
Centers for Disease Control and Prevention's Office on Smoking and Tobacco Use. National Adult Tobacco Survey (NATS). http://www.cdc.gov/tobacco/data_statistics/surveys/nats. Published 2014. Accessed May 5, 2016.
US Department of Health and Human Services. Dietary Guidelines for Americans 2015–2020. 8th ed. http://health.gov/dietaryguidelines/2015/guidelines. Accessed May 5, 2016.
US Department of Agriculture. ChooseMyPlate.gov. http://www.choosemyplate.gov. Accessed May 5, 2016.
Godin G, Shephard RJ. A simple method to assess exercise behavior in the community. Can J Appl Sport Sci. 1985;10:141–146.
Godin G. The Godin-Shephard Leisure-Time Physical Activity Questionnaire. Health Fit J Can. 2011;4:18–22.
Amireault S, Godin G. The Godin-Shephard Leisure-Time Physical Activity Questionnaire: validity evidence supporting its use for classifying healthy adults into active and insufficiently active categories. Percept Mot Skills. 2015;120:604–622.
Cliff N. Dominance statistics: ordinal analyses to answer ordinal questions. Psychol Bull. 1993;114:494.
Habek M, Hojsak I, Brinar VV. Nutrition in multiple sclerosis. Clin Neurol Neurosurg. 2010;112:616–620.
Moore LV, Thompson FE. Adults meeting fruit and vegetable intake recommendations—United States, 2013. MMWR Morb Mortal Wkly Rep. 2015;64:709–713. http://www.cdc.gov/mmwr/preview/mmwrhtml/mm6426a1.htm. Accessed May 5, 2016.
Albertson AM, Reicks M, Joshi N, Gugger CK. Whole grain consumption trends and associations with body weight measures in the United States: results from the cross sectional National Health and Nutrition Examination Survey 2001–2012. Nutr J. 2016;15:8.
Ye EQ, Chacko SA, Chou EL, Kugizaki M, Liu S. Greater whole-grain intake is associated with lower risk of type 2 diabetes, cardiovascular disease, and weight gain. J Nutr. 2012;142:1304–1313.
Plow M, Finlayson M, Cho C. Correlates of nutritional behavior in individuals with multiple sclerosis. Disabil Health J. 2012;5:284–291.
Dalton D, Ortegren M. Gender differences in ethics research: the importance of controlling for the social desirability response bias. J Bus Ethics. 2011;103:73–93.
Hebert JR, Ma Y, Clemow L, et al. Gender differences in social desirability and social approval bias in dietary self-report. Am J Epidemiol. 1997;146:1046–1055.
Motl RW, McAuley E, DiStefano C. Is social desirability associated with self-reported physical activity? Prev Med. 2005;40:735–739.
Financial Disclosures: The authors have no conflicts of interest to disclose.