Publication
Research Article
International Journal of MS Care
Fluid-Attenuated Inversion Recovery Signal Intensity as a Predictor of Gadolinium Enhancement in Relapsing-Remitting Multiple Sclerosis
Background:
Magnetic resonance imaging (MRI) is used to diagnose and monitor disease activity in relapsing-remitting multiple sclerosis (RRMS). The objective of this study was to explore the association of “ultrabright” axial fluid-attenuated inversion recovery (FLAIR) lesions with gadolinium enhancement in patients with RRMS using qualitative and quantitative approaches.
Methods:
MRIs from patients with RRMS from 2010 to 2015 were reviewed. Two radiologists independently identified ultrabright lesions on axial FLAIR sequences. The contrast-to-noise ratio (CNR) was measured for ultrabright and control lesions.
Results:
Of 301 lesions included in the study, 77 (26%) were identified by both radiologists as ultrabright. Interrater agreement was moderate (κ = 0.77, P < .001). Lesions identified by both radiologists as ultrabright demonstrated an association with gadolinium enhancement (χ2 1 = 30.8, P < .001) but were not associated with MRI magnet strength (χ2 1 = 0.24, P = .65). Higher CNR values were associated with gadolinium enhancement for 1.5-T studies (OR, 1.05; 95% CI, 1.02–1.07; P = .001) and 3-T studies (OR, 1.02; 95% CI, 1.02–1.03; P < .001). Diagnostic accuracy of the quantitative model was good for 1.5-T studies (area under the curve, 0.79; 95% CI, 0.68–0.9; P < .001) and 3-T studies (area under the curve, 0.78; 95% CI, 0.73–0.84; P < .001). Positive predictive value of 100% was obtained for CNR values of 92 for 1.5-T and 184 for 3-T studies.
Conclusions:
Qualitatively and quantitatively identified ultrabright axial FLAIR lesions are significantly associated with gadolinium enhancement.
Magnetic resonance imaging (MRI) is an invaluable investigation in establishing the diagnosis and monitoring the disease activity in relapsing-remitting multiple sclerosis (RRMS). Gadolinium-based sequences use its property to visualize transient blood-brain barrier breakdown believed to take place in acute inflammatory multiple sclerosis (MS) lesions1 and are incorporated in the 2010 revised McDonald criteria.2 However, certain contraindications to the use of gadolinium contrast agents exist, such as allergic reactions and decreased renal function.3 Recently, a neuronal tissue deposition of gadolinium has been demonstrated irrespective of renal function.4
This study is based on our personal observation that in patients with RRMS, demyelinating lesions of outstanding brightness (“ultrabright”) on noncontrast axial fluid-attenuated inversion recovery (FLAIR) MRI are more likely to be enhanced with gadolinium. Recently, a group of investigators explored the association between the higher-than-average T2 signal and gadolinium enhancement in the RRMS population.5 In their retrospective study of 42 patients, only 44% of the lesions rated as brighter than other T2 lesions demonstrated enhancement (P = .294). Important limitations of this study were its purely qualitative evaluation, use of 1- and 1.5-T MRI scanners, and use of T2 sequence, which was shown to be inferior to FLAIR in certain types of MS lesions.6
Herein we compared the visual identification of ultrabright FLAIR lesions with the signal intensity quantification approach, association with gadolinium enhancement, and the predictive power of both methods.
Methods
Approval, Study Design, and Study Population
This study was approved by the University of Manitoba Health Research Ethics Board (protocol number HS18612 [H2015:198]).
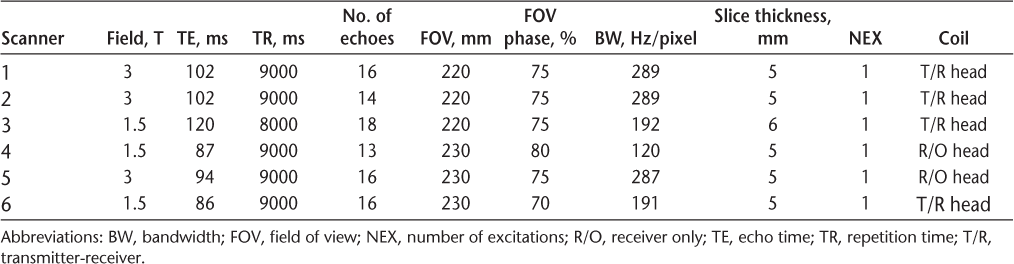
The MS Clinic database at the Health Sciences Centre, Winnipeg (Manitoba, Canada) was searched for patients diagnosed as having RRMS who had brain MRIs (1.5 or 3 T), including axial FLAIR and pre– and post–gadolinium enhancement T1 images, from January 1, 2010, through December 31, 2015. Axial FLAIR and pre– and post–gadolinium enhancement T1 images were extracted from the Picture Archiving and Communication System as anonymized images in DICOM (Digital Imaging and Communications in Medicine) format. In all cases included, the gadolinium was administered after the axial FLAIR sequence was obtained. Owing to the limited availability of the neuroradiologists, a two-tier approach was implemented. First, the scans were reviewed by one of us (M.G.), and those that contained lesions subjectively perceived to be of considerably higher signal intensity compared with the others (ultrabright) were selected. These were combined with the studies seemingly devoid of such ultrabright lesions. The resulting pool of scans was then independently reviewed by two neuroradiologists (M.E. and A.P.). The two neuroradiologists reviewed axial FLAIR images separately while remaining blinded to the enhanced sequences and visually identified the ultrabright lesions. A limit of five ultrabright lesions per patient was applied to avoid overrepresentation of the small number of patients who have multiple qualifying lesions. From each study participant, a random lesion that was not labeled ultrabright by either of the neuroradiologists was chosen by one of us (M.G.), who remained blinded to the enhancement status of the lesion, to create a control group. Some scans contained few lesions that were all ultrabright—in this case, an additional control lesion was taken from the patients with multiple lesions to match the number of lesions identified as ultrabright by either neuroradiologist. Next, one of the neuroradiologists (A.P.) reviewed the T1 sequences before and after gadolinium enhancement and identified matching enhanced lesions (study patients' identification numbers were recoded). In the final step, the gadolinium-enhancing lesions that were not captured during the previously mentioned steps were added to the database to ensure the inclusion of all false-negatives (nonultrabright enhancing lesions). All the lesions were circumscribed using a circular region of interest, and the average signal intensity was calculated in arbitrary units using the picture archiving and communication system client used by the hospital server. The contrast-to-noise ratio (CNR) was calculated as follows: CNR = (SIlesion – SInormal-tissue)/SDnoise, where SI indicates signal intensity and SDnoise indicates the SD of the background noise. For heterogeneous lesions, only the ultrabright component was circumscribed. For all scans, strength of the MRI magnet used was recorded, and statistical analyses were performed for the 1.5- and 3-T groups separately.
Data Analysis
All the statistical analyses were performed using IBM SPSS Statistics for Windows, version 22.0 (IBM Corp, Armonk, NY). The association between MRI magnet strength and ultrabright lesions was assessed using the χ2 test. The χ2 test was also applied to assess the association between visually ultrabright FLAIR lesions as identified by both radiologists and gadolinium enhancement. The agreement between the radiologists for identification of the ultrabright FLAIR lesions was evaluated using Cohen's kappa statistic. The significance of gadolinium enhancement prediction using FLAIR CNRs was assessed using binomial logistic regression. Diagnostic accuracy of the quantitative method was assessed using the area under the receiver operating characteristic curve. Contingency tables were used to calculate the sensitivity and positive predictive values (PPVs) of gadolinium enhancement for visually identified ultrabright lesions and CNR values.
Results
Patients and Lesions
Brain MRIs for 1109 patients from the MS Clinic were reviewed for possible ultrabright lesions, and 81 patients (7%) were selected. The selected patients were predominantly (72%) female, and the mean (SD) age was 36.9 (10.4) years. Information regarding corticosteroid use was not accessible in the database. Three hundred one lesions were included in the analysis. One hundred seven lesions were identified as ultrabright by either of the neuroradiologists. Sixty-seven of them (63%) were predated by a gadolinium administration 23 to 2450 (mean, 537) days earlier. All the lesions were of typical morphology and distribution characteristic for patients with MS, as agreed on by both neuroradiologists, although the possibility of having confounding nondemyelinating lesions cannot be completely excluded. Of 301 lesions included in the analysis, 229 (76%) were obtained using a 3-T MRI scanner and 72 (24%) using a 1.5-T MRI scanner.
Qualitative Method
Seventy-seven lesions (26%) were perceived to be of outstanding signal intensity by both neuroradiologists and were labeled as ultrabright. The remaining 224 lesions were labeled as nonultrabright. There was no significant association between MRI magnet strength and ultrabright lesion detection (χ2 1 = 0.24, P = .65). The ultrabright lesions were more likely to be enhanced with gadolinium than were the nonultrabright ones (χ2 1 = 30.8, P < .001). The kappa statistic of interrater agreement was moderate (κ = 0.77, P < .001). The PPV of visually identified ultrabright lesions for predicting gadolinium enhancement was 88% (sensitivity, 37%).
Quantitative Method
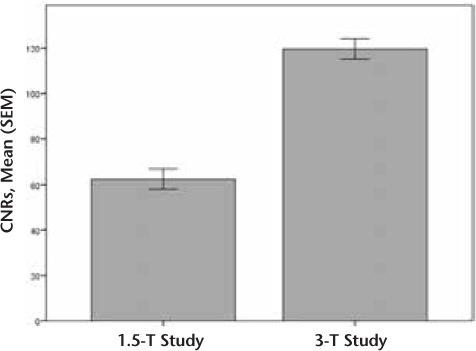
The CNRs were calculated for the 1.5-T group (n = 72, mean [SEM] = 62.4 [4.4]) and the 3-T group (n = 229, mean [SEM] = 119.6 [4.5]) (Figure 1).


Mean (SEM) contrast-to-noise ratios (CNRs) for 1.5- and 3-T studies
1.5-T Group
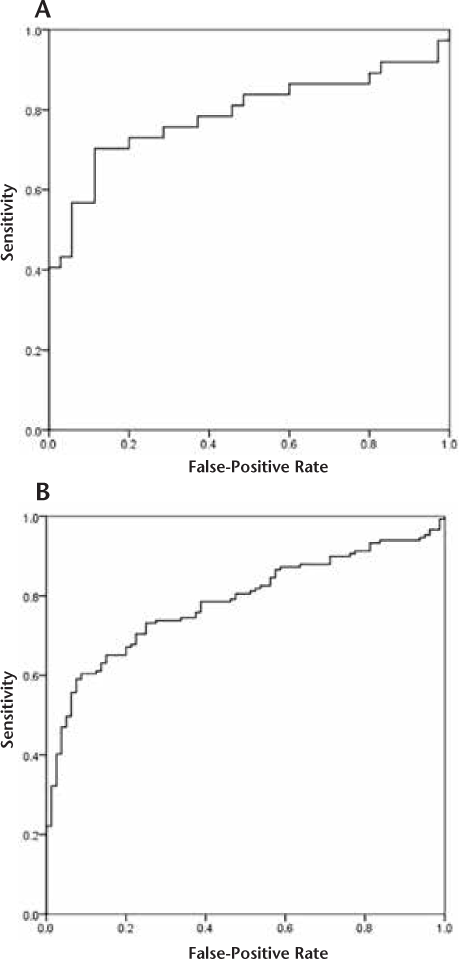
Binomial logistic regression demonstrated that lesions with higher CNRs have increased odds of gadolinium enhancement (OR, 1.05; 95% CI, 1.02–1.07; P = .001). The diagnostic accuracy of the quantitative model was good (area under the curve, 0.79; 95% CI, 0.68–0.90; P < .001) (Figure 2A). The CNR cutoff value of 92 had a PPV of 100% (sensitivity, 41%). Twelve such lesions (16.7%) were identified.


Receiver operating characteristic curves for gadolinium enhancement prediction using lesion contrast-to-noise ratios
3-T Group
Binomial logistic regression demonstrated that lesions with higher CNRs have increased odds of gadolinium enhancement (OR, 1.02; 95% CI, 1.02–1.03; P < .001). The diagnostic accuracy of the quantitative model was good (area under the curve, 0.78; 95% CI, 0.73–0.84; P < .001) (Figure 2B). The CNR cutoff value of 184 had a PPV of 100% (sensitivity, 22%). Thirty-one such lesions (13.5%) were identified.
Discussion
The results of this retrospective study confirm an association between ultrabright lesions on axial FLAIR and gadolinium enhancement in patients with RRMS. The association was significant for both qualitative and quantitative approaches. This somehow contrasts with the study by Treaba et al.,5 in which a significant association was observed for only the lesions of highest signal intensity that also had a T2-hypointense rim. Such a hypointense rim has been linked to ferritin or hemosiderin content in activated macrophages at the lesion border.7 8
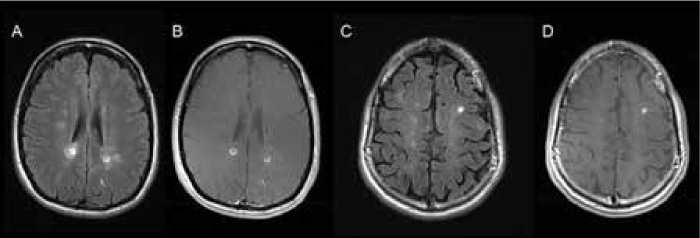
The qualitative approach demonstrated mixed results. On the one hand, the detection rate of ultrabright lesions was independent of the MRI magnet strength; on the other hand, the interrater agreement was moderate. Although the lesions of outstanding FLAIR hyperintensity (Figure 3) were unanimously categorized as ultrabright by both neuroradiologists, a proportion of lesions of above-average signal intensity are in the “grey zone,” which causes the neuroradiologists' disagreement. This, in our opinion, reflects the subjective nature of visual identification of ultrabright lesions.


Examples of “ultrabright” lesions
The quantitative approach proved to more reliably predict the gadolinium enhancement compared with the visual identification of ultrabright lesions. The retrospective nature of the study precluded measurement of T2 relaxation times, and the CNR was used instead.9 The CNR depends on the number of excitations, which was identical across the studies (n = 1) (Table 1). The CNR is also affected by the MRI magnet strength, which was addressed by performing a separate analysis for the data obtained using 1.5- and 3-T scanners. Higher CNRs were significantly associated with gadolinium enhancement irrespective of the magnet strength. The cutoff values for 100% PPV were different for 1.5- and 3-T magnets, as expected.


Summary of axial fluid-attenuated inversion recovery scan parameters used in study
Although gadolinium enhancement is widely accepted to represent the blood-brain barrier leakage, interpretation of T2/FLAIR signal intensity is less specific. Previously, a model of degenerative and inflammatory processes combined with a resorbing and reparatory process has been proposed to explain high T2/FLAIR signal in MS lesions.10 The results of the present study indicate that ultrabright lesions are likely to enhance with gadolinium, but many enhancing lesions are not ultrabright, reflecting the poor sensitivity of the method. Although we cannot provide any explanation for this discrepancy, this finding is compatible with the model of Meier and colleagues10 and may reflect a certain point of balance between the several underlying pathophysiologic processes. We can speculate that ultrabright lesions represent a very brief, possibly hyperacute phase of the demyelinating plaque, which explains its low prevalence.
Although FLAIR imaging is considered superior to T2 sequences in detecting supratentorial cortical lesions in MS, it does not offer better sensitivity in identifying periventricular and deep white matter lesions, which constituted most of our studied lesions.6 Interestingly, proton density–weighted sequences with prolonged repetition times at 3 T may be superior to FLAIR imaging for the detection of periventricular MS lesions.11 This raises the possibility of detecting more ultrabright lesions using proton density–weighted imaging and potentially improving detection sensitivity.
A major limitation of this study is related to its retrospective design and preselection of the scans with possibly ultrabright lesions by one of us (M.G.) for further review by the neuroradiologists. This was dictated by the low prevalence of ultrabright lesions from our experience and the limited availability of the neuroradiologists. However, the overwhelming majority of the preselected scans contained several lesions, so the neuroradiologists had to execute their judgment as to whether each scan had an ultrabright lesion. The results of this study do not allow commenting on the method's negative predictive value or specificity (hence, false-positive rate), because not all nonenhancing nonultrabright lesions, that is, true-negatives, were included for technical reasons—many such lesions had poorly defined margins or were confluent, and at times were innumerable, which precluded accurate manual measurement. These limitations, in our opinion, can be overcome. First, it is obvious that the PPV of 88% renders the qualitative method unreliable, as a sizable proportion of the ultrabright lesions will not enhance. However, the application of the cutoff CNR with 100% PPV offers an advantage of excluding all false-positives and, hence, addresses the specificity issue. Second, from the high false-negative rate (60%–80%), one can already infer a less-than-optimal negative predictive value of the method, which can be overcome by applying it only to the scenarios when the ultrabright lesion is present.
The novelty of this study is the quantitative approach to the definition of ultrabright lesions. The low sensitivity of the method (20%–40%) means that it cannot supplant gadolinium administration; however, precalculated CNR cutoff values may be applied retrospectively in situations in which gadolinium sequences were not obtained due to technical reasons or the patient's intolerance of the procedure. Given the higher prevalence of the gadolinium-enhanced lesions in the present patient sample compared with the unselected RRMS population, validation of these findings in a larger-scale study is required.
PRACTICE POINTS
This study demonstrates the feasibility of qualitative and quantitative identification of “ultrabright” lesions to predict gadolinium enhancement in scans where gadolinium sequences were not obtained due to technical reasons or the patient's intolerance of the procedure.
Financial Disclosures:
The authors have no conflicts of interest to disclose.
References
Lassmann H. The pathologic substrate of magnetic resonance alterations in multiple sclerosis. Neuroimaging Clin N Am. 2008;18:563–576.
Polman CH, Reingold SC, Banwell B, et al. Diagnostic criteria for multiple sclerosis: 2010 revisions to the McDonald criteria. Ann Neurol. 2011;69:292–302.
Perazella MA. Current status of gadolinium toxicity in patients with kidney disease. Clin J Am Soc Nephrol. 2009;4:461–469.
McDonald RJ, McDonald JS, Kallmes DF, et al. Intracranial gadolinium deposition after contrast-enhanced MR imaging. Radiology. 2015;275:772–782.
Treabă CA, Bălaşa R, Podeanu DM, Simu IP, Buruian MM. Cerebral lesions of multiple sclerosis: is gadolinium always irreplaceable in assessing lesion activity? Diagn Interv Radiol. 2014;20:178–184.
Woo JH, Henry LP, Krejza J, Melhem ER. Detection of simulated multiple sclerosis lesions on T2-weighted and FLAIR images of the brain: observer performance. Radiology. 2006;241:206–212.
Brück W, Bitsch A, Kolenda H, Brück Y, Stiefel M, Lassmann H. Inflammatory central nervous system demyelination: correlation of magnetic resonance imaging findings with lesion pathology. Ann Neurol. 1997;42:783–793.
Llufriu S, Pujol T, Blanco Y, et al. T2 hypointense rims and ring-enhancing lesions in MS. Mult Scler. 2010;16:1317–1325.
Essig M, Knopp MV, Schoenberg SO, et al. Cerebral gliomas and metastases: assessment with contrast-enhanced fast fluid-attenuated inversion-recovery MR imaging. Radiology. 1999;210:551–557.
Meier DS, Weiner HL, Guttmann CRG. MR imaging intensity modeling of damage and repair in multiple sclerosis: relationship of short-term lesion recovery to progression and disability. AJNR Am J Neuroradiol. 2007;28:1956–1963.
Schmidt C, Hattingen E, Faehndrich J, Jurcoane A, Porto L. Detectability of multiple sclerosis lesions with 3T MRI: a comparison of proton density-weighted and FLAIR sequences. J Neuroradiol. 2012;39:51–56.