Publication
Research Article
International Journal of MS Care
Predictors of Mortality in Veterans with Multiple Sclerosis in an Outpatient Clinic Setting
Multiple sclerosis (MS) is a neurodegenerative condition that leads to cognitive and physical impairments, resulting in disability and shortened life expectancy. It is the most common neurologic cause of debilitation in young people and is more common in white individuals and women. According to the National Institute of Neurological Disorders and Stroke, approximately 250,000 to 350,000 people in the United States are currently diagnosed as having MS.1 2 In an Australian study, compared with the average population, there was a 10% reduction in time until death in patients with MS 20 years or more after disease onset: median time from onset of symptoms to death was 42 years.3
Studying mortality in chronic neurologic diseases may identify factors that are treatable and help improve medical care. Population-based studies identified cause of death as neurologic in 88% of patients with motor neuron disease, 64% with MS, 56% with Parkinson's disease, and 48% with epilepsy based on English death records from 1979 to 2006.4 The main recorded underlying causes of death in patients with MS in both population- and clinic-based studies have been increasing age, MS disease itself such as MS type on presentation, MS-related contributory causes such as respiratory and infection diseases, and cancer.5–7 Mortality for MS varies from 3% (4 deaths among 122 patients with MS) in a Brazilian study8 to 14% (8 deaths among 57 patients with MS) in a UK study.9 An overall age-adjusted mortality rate for MS in the United States is 1.44 per 100,000 population.2 MS mortality rates are higher in white individuals than in other racial/ethnic groups. Asian individuals and Pacific Islanders had ten times lower mortality rates compared with white individuals.2 In an Italian study, no significant sex difference was found in decreased life expectancy,6 whereas in a Canadian study, the decrease in life expectancy was 7.7 years for men and 12.8 years for women.10 Several other factors, such as earlier age at onset and a short interval between onset and secondary progression, have been found to increase the risk of early death.11
Given these varied findings, further research is needed to provide insight into the factors associated with increased mortality, which when addressed may delay death. Therefore, the aim of this study was to explore predictors of mortality in a sample of veterans with MS who are enrolled and have been regularly followed up in the MS clinic in the Oklahoma City Veterans Affairs Medical Center (VAMC), as, to our knowledge, MS-related mortality has not been previously studied in the veteran population in a clinical setting. Veterans constitute 7% (22 million) of the US population, and they receive medical care irrespective of their socioeconomic status. The findings of this study will help further improve the provision of care to veterans with MS provided by MS centers in the VA system.
Methods
Participants
After receiving institutional review board approval, a retrospective electronic medical record review was undertaken of 229 veterans with MS diagnosed based on the McDonald criteria12 who were registered in the MS program at the Oklahoma City VAMC from January 1, 2000, through December 31, 2014, and were followed up every 4 months in the clinic. Throughout follow-up, patients received both a letter reminding them of their upcoming clinic appointment and a phone message reminder 24 to 48 hours before the date of their clinic visit. However, a mean ± SD range of 120 ± 30 days was considered acceptable for inclusion in the study given that the clinic is set up that way. MS diagnosis required objective clinical evidence of two or more lesions disseminated in time and space. All the patients underwent baseline magnetic resonance imaging (MRI) with gadolinium, with follow-up MRI performed at regular intervals. We took into account the MRI findings when defining the MS diagnosis. In 2001, heavy emphasis was placed on MRI as a tool in MS diagnosis, and all subsequent modifications of the criteria have done so as well. This represents all patients with MS seen in the clinic during this time frame. Three patients were excluded due to incomplete records/missing data. Data collected from electronic medical records maintained in the VA system included age at the initial (first) clinic visit, sex, ethnicity/race, age at MS diagnosis, clinical MS subtype (relapsing-remitting MS [RRMS], secondary progressive MS [SPMS], primary progressive MS [PPMS], clinically isolated syndrome, or radiologically isolated syndrome),13 and initial presenting features (visual concerns, motor weakness, balance disorder, and sensory issues). An impairment index was determined based on the presence or absence of motor (weakness and/or ataxia) and nonmotor (visual and sensory) signs on initial examination. MS severity was measured by initial Expanded Disability Status Scale (EDSS)14 and total Functional Independence Measure (FIM)15 scores. The EDSS and total FIM scores were documented by a board- and FIM-certified neurologist on the first and subsequent annual evaluations. Data were collected until December 31, 2014. Preexisting and new-onset comorbidities commonly encountered in the veterans and causing most of the disability and death, such as the presence of hypertension, hyperlipidemia, diabetes mellitus, a high body-mass index (BMI), and a current history of smoking, during this period were recorded.16 These comorbidities also happen to be the most common causes of disability and death in the US general population.17 In addition, the presence of MS-related complications, such as pressure ulcers and neurogenic bowel and bladder, was recorded. Cause(s) and location (home, long-term care facility, or hospital) of death were obtained from patients' death certificates.
Statistical Analysis
Group statistics are expressed as mean ± SD and frequencies. The two study groups were those who did and those who did not die during the study period. Differences in baseline (entry into the study) clinical characteristics were examined. Continuous data were compared between groups using a two-tailed t test; categorical data were compared using the χ2 or the Fisher exact test, as appropriate. Time until death was calculated as time from date of entry into the study to either the end-of-study date for still living patients or the date of death for deceased patients. Overall time until death was analyzed using Kaplan-Meier methods.18 Comparisons of Kaplan-Meier curves between groups were made using Mantel-Cox log-rank tests. Cox proportional hazards regression models evaluated the association of time until death with individual independent variables such as age at MS diagnosis, sex, MS severity (initial EDSS and total FIM scores), MS type, impairment index, and modifiable vascular risk factors, diabetes mellitus, BMI, presence/absence of pressure ulcers, neurogenic bladder and bowel, and use of immunomodulatory therapy. Cox model findings are summarized using hazard ratios and 95% confidence intervals.
A concern with the all-inclusive analysis is that it includes patients who had MS diagnosed a decade or more before the January 1, 2000, start of the study, some as early as 1951; in short, it is not an inception cohort. This may bias the mortality analysis because people with early year of onset who died before 2000 are missing from the study. To determine the effects of possible bias due to including patients with long disease duration before their entry into the study, we imposed a cutoff year of diagnosis of 1995, excluding patients with MS diagnosis before 1995. This date was based first on observing that of 70 patients with year of diagnosis of 2000 or later, the minimum time until death for those who died was 8 years and second on the need to retain a reasonable sample size. Analyses were repeated on this subcohort.
The standardized mortality ratio (SMR) was calculated comparing veterans with MS with the general population of Oklahoma and comparing veterans with MS with veterans in general attending the Oklahoma City VAMC.
Data analyses were performed using IBM SPSS Statistics for Windows, version 20.0 (IBM Corp, Armonk, NY). Probability values are given to two significant digits, with P < .05 considered significant.
Results
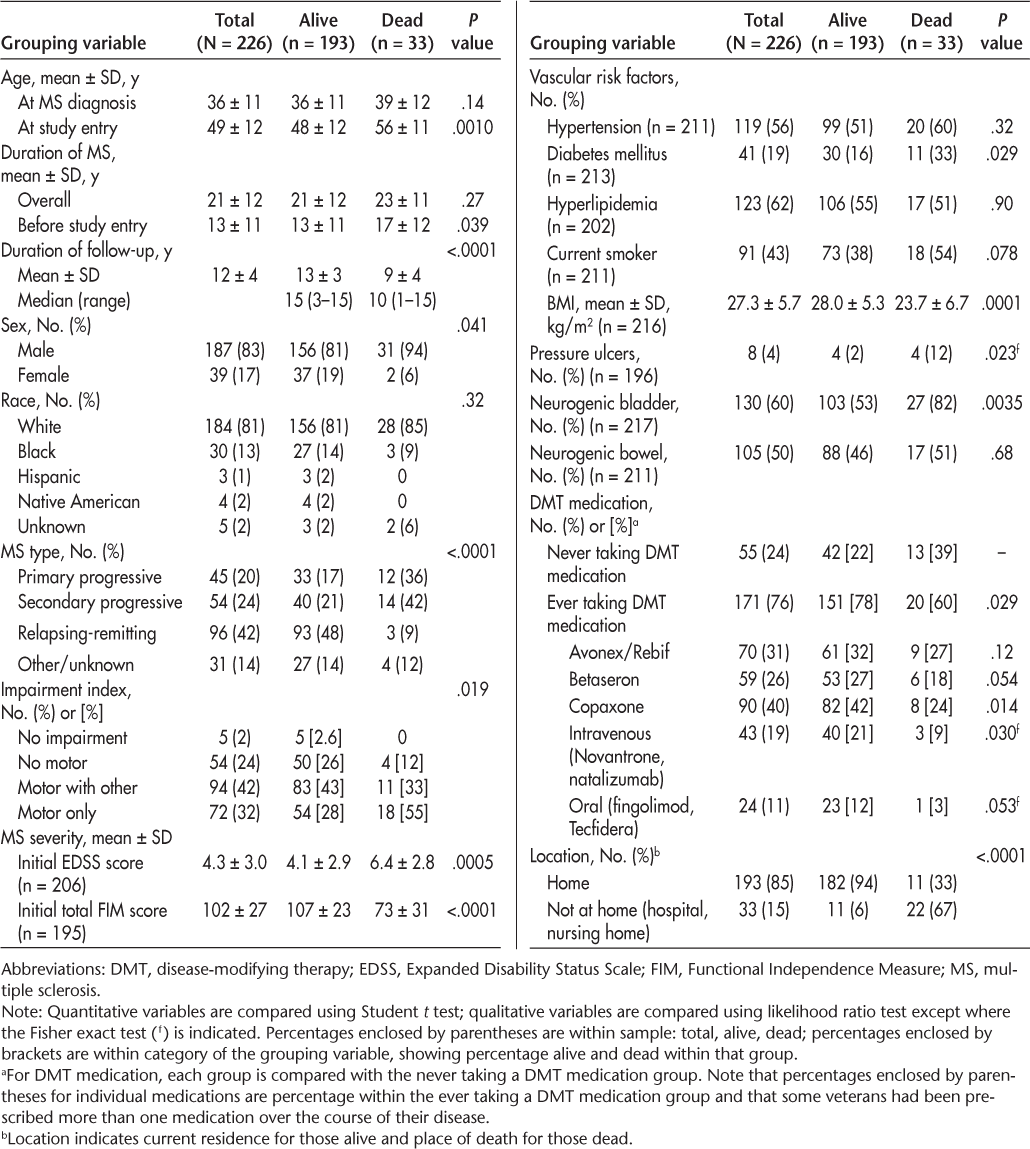
Table 1 presents the baseline characteristics of the study sample (N = 226). Non-Hispanic white men made up 83% of the study population. Mean ± SD age at the initial clinic visit was 49 ± 12 (range, 25−78) years. Mean ± SD age at the time of MS diagnosis was 36 ± 11 (range, 16–68) years, and mean duration since MS diagnosis was 21 ± 12 (range, 2–58) years. For those who died during the study period, mean ± SD time until death after diagnosis of MS was 23 ± 11 (range, 8–52) years. Mean ± SD rates of 10- and 15-year mortality after MS diagnosis were 2% ± 1% and 4% ± 2%, respectively. The main MS types at the first clinic visit were RRMS (42%), SPMS (24%), PPMS (20%), and clinically isolated syndrome (7%). At the initial clinic visit, mean ± SD EDSS and total FIM scores were 4.3 ± 3.0 and 102 ± 27, respectively. Veterans with MS were more likely to die if they presented with a progressive MS course (Figure 1A), greater initial disability (high EDSS and low total FIM scores), and motor concerns (weakness and/or ataxia) (Figure 1B). Mortality was not age dependent. Veterans who were prescribed disease-modifying therapy (DMT) had a lower mortality rate compared with those who were never prescribed DMT (Figure 1C). To some extent, this can be attributed to the higher use of DMT in patients with RRMS (90%) compared with patients with PPMS/SPMS (68%). For patients with PPMS/SPMS, DMT reduced mortality (22% receiving DMT vs. 32% not receiving DMT) and increased survival (mean ± SD: 10 ± 4 years receiving DMT vs. 8 ± 5 years not receiving DMT), although neither reached statistical significance. The presence of comorbidities was not associated with DMT.


Baseline demographic characteristics of 226 veterans with MS, categorized as alive or dead at study's end


Kaplan-Meier survival curves for relapsing-remitting multiple sclerosis (MS) and primary and secondary progressive MS (A); with and without motor symptoms (B); and ever and never taking disease-modifying therapy (DMT) medication (C)
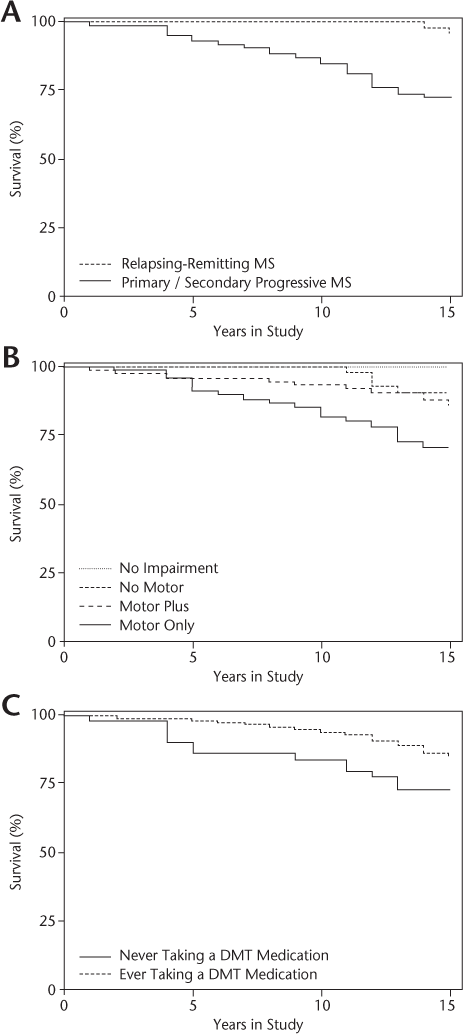
MS-related mortality at the end of the 15-year study was 14% (33 deaths), giving a mortality rate of 15.5 per 1000 person-years. Mortality in men was 16% (17.6 per 1000 person-years) compared with 5% in women (5.5 per 1000 person-years). At the initial clinic evaluation, men were significantly older than women (mean ± SD age: 50.5 ± 12 vs. 43.5 ± 12 years; P = .0010) and had a higher percentage of progressive MS type (SPMS: 25.7% vs. 15.4%; PPMS: 23% vs. 5%; P = .0078). Figure 1A shows Kaplan-Meier survival curves for the RRMS versus PPMS/SPMS groups. The difference between the two groups is significant at P < .0001 (Mantel-Cox log-rank test).
Death certificates documenting one or more causes of death were available for 28 of the individuals. The causes of death were MS disease itself (n = 16 [57%]), infection (due to sepsis and pneumonia, n = 11 [39%]), carcinoma (n = 5 [18%]), respiratory failure (n = 5 [18%]), myocardial infarction (n = 3 [11%]), and others (n = 5 [18%]). Most veterans died in the hospital (n = 16 [55%]). Time until death was 9.3 (range, 4–14) years for infection, 11.2 (range, 8–13) years for carcinoma, 7.0 (range, 4–15) years for respiratory failure, 5.0 (range, 1–12) years for myocardial infarction, and 11.0 (range, 8–14) years for others. Veterans with progressive MS were more likely to die in the hospital (91%), whereas those with RRMS died at home (67%). Similarly, veterans with MS who were more disabled (EDSS score ≥6.5) were more likely to die in the hospital, whereas veterans who were less disabled (EDSS score ≤3) died at home. Infection was the main cause of death for those dying in hospital.
Kaplan-Meier analysis determined the overall mean ± SD estimated time until death since MS diagnosis to be 21 ± 12 years. Cox proportional hazards regression analysis (Table 2) examined the relationship between mortality and variables associated with mortality either from published observations or because of significant differences shown in Table 1. For the whole cohort, older age at entry into the study; presence of sensory, cerebellar, or motor (weakness and/or ataxia) concerns on presentation; progressive MS type; more disability on presentation (high EDSS, low Mini-Mental State Examination, and low total FIM scores); higher BMI; being diabetic; not ever receiving DMT; and presence of pressure ulcers or neurogenic bladder were significant predictors of higher mortality. The SMR for this MS population was 1.35 compared with the general population of Oklahoma and 0.47 compared with the Oklahoma City VAMC population.


Cox proportional hazards regression analysis of variables suggested to predict mortality in veterans with MS
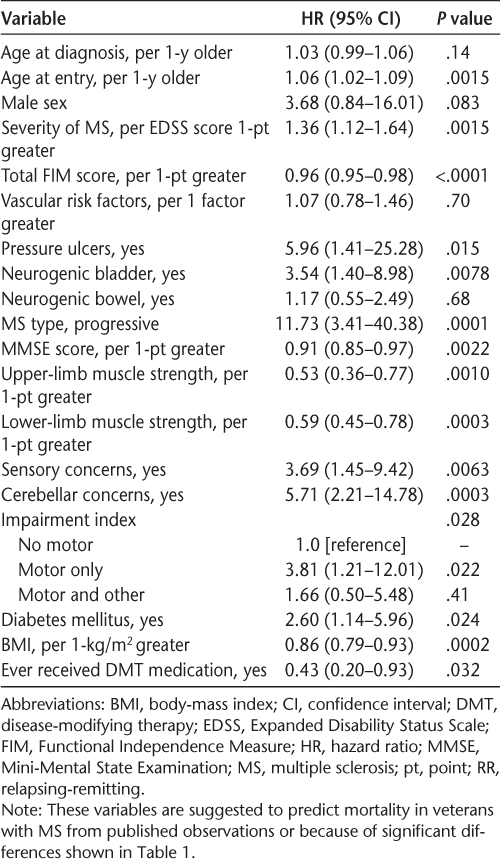
A concern with the all-inclusive analysis was that it included patients who had MS diagnosed a decade or more before the January 1, 2000, start of the study, leading to bias in the analysis of mortality. As described in the Methods section, we imposed a cutoff year of diagnosis of 1995, excluding patients with an MS diagnosis before 1995. Of the 108 patients remaining, eight died during the study period. Mean ± SD age at the initial clinic visit was 44 ± 12 (range, 25−69) years. The mean ± SD age at the time of MS diagnosis was 39 ± 12 (range, 21−68) years, and mean duration since MS diagnosis was 11 ± 5 (range, 2−19) years. For the eight patients who died, mean ± SD time until death after diagnosis of MS was 12 ± 3 years. Mean ± SD rates of 10- and 15-year mortality after MS diagnosis were 4% ± 2% and 10% ± 4%, respectively, which were higher than those for the whole cohort (2% ± 1% and 4% ± 2%, respectively). The main MS types were RRMS (51%), PPMS (21%), and SPMS (10%). At the initial clinic visit, mean ± SD EDSS and total FIM scores were 3.1 ± 2.8 and 110 ± 22, respectively. In this group, no veterans with RRMS died, making progressive MS a clear indicator of higher mortality despite the inability to estimate a hazards ratio. Similarly, the smaller sample size of the subcohort and the low numbers of deaths in some categories destabilized the estimation of the hazard ratios for some variables, such as pressure ulcers, neurogenic bladder, and motor concerns (which were no longer significant) and sensory and cerebellar concerns (which remained significant). In the subcohort, veterans with MS remained more likely to die if they had older age at entry into the study, were initially more disabled (low total FIM and Mini-Mental State Examination scores), and showed motor weakness (low limb strength). A variable now significant but not in the whole cohort analysis was age at diagnosis of MS. Further variables that were no longer significant predictors of increased mortality in the subcohort were high initial severity of MS (high EDSS score), ever receiving DMT, and high BMI.
Discussion
In this observational study of veterans with MS, mortality was 14% at the end of the 15-year study. Similarly high mortality of 14% was found in patients with MS in Italian and UK studies.6 9 For those dying during the study period, the mean ± SD time until death after diagnosis of MS was 23 ± 11 years. There were approximately as many deaths in the first two-thirds of the study period as there were in the last third. From 2000 through 2009, there were 18 deaths in 180 patients with MS (14.5 per 1000 person-years), with a mean ± SD age at death of 60 ± 10 (range, 43−76) years. All 18 deaths were in patients with progressive MS, giving a mortality rate of 24.4 per 1000 person-years (32.4 for PPMS, 20.1 for SPMS). From 2010 through 2014, there were 15 deaths in 208 patients with MS (16.3 per 1000 person-years), with a mean ± SD age at death of 64 ± 10 (range, 41−81) years. Three deaths were in patients with RRMS (6.8 per 1000 person-years) and 12 were in those with progressive MS (30.1 per 1000 person-years: 31.3 for PPMS, 29.3 for SPMS). Similarly, there were approximately as many patients entering the study in the first half of the study period as there were in the last half, after the initial intake of existing patients. Men were more likely to die, similar to findings in population-based MS mortality studies, although this sex difference did not reach statistical significance. Men are usually older and with progressive MS type at initial presentation.19–23 Similar to other studies, we found no association between age at diagnosis and mortality in the whole study cohort.12 20–22 24 However, an association between age at diagnosis and mortality was found when the truncated cohort with year of diagnosis during or after 1995 was used, possibly because the few early-onset, long-time survivors who were suspected of causing bias were now omitted.
The main contributing causes of death were MS disease itself (57%), followed by MS-related complications, including infection (43%) and cancer and respiratory failure (18% each). Similarly, MS disease was identified as the neurologic cause of death in 64% of patients in English death records from 1979 to 2006.4 In a recent large observational study, the UK Clinical Practice Research Datalink, in which 1713 patients with MS were identified between 1993 and 2006, found infection (76%), heart disease (72%), and cancer (81%) to be responsible for all-cause mortality.25 In 2007 we focused our attention on reducing the burden of modifiable vascular risk factors. This resulted in a lower number of vascular-related deaths from 2008 through 2014. Similar lower mortality rates from vascular-related deaths have been shown in several other population-based studies of patients with MS where the vascular factors were aggressively treated.5 26 27 Availability of DMT increases the life expectancy of patients with MS, leading to an increase in age-related immune system change, which is less effective in dealing with micro-organisms and cancer cells, thus increasing their susceptibility to infections and cancer as causes of death. Veterans in the 2008 through 2014 period were older (mean, 53 [range, 22−78] years), making them more prone to cancer-related (80%) and infection-related (67%) deaths. Infections in the present study were mainly pneumonias and septicemia; none of the patients died of urinary tract infection despite the frequent presence of neurogenic bladder in these patients, as seen in other studies.9 25–27 Pressure ulcers are unlikely to cause death directly but increase the risk of infection/osteomyelitis, leading to MS-related deaths. In a Norwegian study, patients with MS were ten times more likely to die of infection than the general population.5 Similar to the present study, a study of 7743 veterans with MS conducted between 1999 and 2010 found a 50% greater risk of infection-related hospitalization and death. Infection was due mainly to pneumonia, urinary tract infection, and septicemia.28 This increased risk of infection in patients with MS may be due to the increase in life expectancy of these patients, the disease itself, and the use of DMT. Respiratory failure as a cause of death in 18% of cases was not related to the presence of MS brainstem plaques on head MRIs. Respiratory failure was seen in 1.5% of patients in a Norwegian study5 to 47.5% in a Welsh study.26 We are unable to explain this finding, other than these patients had progressive MS with severe disability.
We found that on initial presentation, the presence of progressive MS type, motor involvement, neurogenic bladder, pressure ulcers, a higher level of disability, diabetes mellitus, and a lower BMI were significantly associated with hazard of death. Bergamaschi et al.11 similarly found that earlier age at diagnosis, a shorter interval between diagnosis and progressive disease course, and early disability increased risk of death in their two cohorts of 52 and 83 patients with MS. Veterans with MS who also had diabetes mellitus, both of which are autoimmune diseases, had an increased risk of other complications, such as infection, and were more likely to die of it. However, veterans with MS who died had a lower BMI, contrary to the understanding that obese patients with MS are more likely to die because of lower circulating vitamin D levels.19 In the present study, level of BMI (≤30 vs. >30 kg/m2) had no effect on mortality, and neither was there an association between BMI and vitamin D levels. Therefore, obesity per se was not associated with mortality. Rather, it was a few underweight (at the time of study entry after many years with MS) individuals with long disease duration who drove the association of lower BMI with increased mortality. Association with lower BMI was not found in the truncated subcohort (MS diagnosed during or after 1995).
Veterans with MS were more likely to die prematurely, as the SMR in this study was 1.35 times (or 135%) higher in the MS population relative to the general Oklahoma population from which the veterans were drawn. This is lower than the SMRs of 2.47 and 2.79 in Norwegian5 and Welsh26 population-based studies, respectively. The lower SMR in the present study could be a reflection of better access to medical care, better medical care (such as prescription of immunomodulatory treatments, symptomatic treatment of MS-related complications, and prevention of comorbidities, especially decreased vascular risk factor–related mortality), and access to rehabilitation services, resulting in veterans with MS having a near-normal life expectancy. The SMR for the veterans served by the Oklahoma City VAMC for the same period as the present study was 0.47. This low SMR in the non-MS veteran population is due mainly to the recent increase in influx of younger veterans returning from the Iraq and Afghanistan wars who happen to be relatively physically healthy but experience mental traumas of war, such as mild traumatic brain injury or posttraumatic stress disorder.
Study Limitations
First, the sample is primarily composed of male veterans (women make up only 10% of the total veteran population), with easier access to care under the VA system compared with the general US population, possibly making generalization to the general population of patients with MS difficult. However, the standard of MS care provided is no different for veterans with MS compared with the general population. Second, the sample size is small and may preclude detecting important differences between groups. Third, for patients with a long duration of MS before entry into the study, there is recall and other biases, as well as the assumption that measures taken at study entry reflect these measures at the time that their MS was diagnosed. Fourth, the manner in which patients were entered into the study created a bias in estimates of mortality parameters, such as underestimation of 10-year mortality. Selecting a subcohort alleviated this bias but exacerbated the small sample size limitation. However, analysis of this truncated cohort did mostly reach the same general conclusions, showing that the bias has a small effect. Fifth, cause of death based on death certificates may not, in all patients, give a definitive reason for death because there was no autopsy-confirmed information.28
Study Strengths
First, completeness of the data captured by the standardized active MS registry over a 15-year period is a strength of this study, and it provided a rich data set to better understand predictors of mortality in the veteran population with a confirmed clinical diagnosis of MS. Second, there was documentation of the level of disability on initial and follow-up evaluation, and before death. Third, electronic medical records were prospectively collected. This study analyzed prospectively collected data, which are collected at face-to-face encounters at the clinic visit using a standardized format encompassing all necessary clinic variables that have to be completed before the clinic visit note can be signed. There was no recall-of-information bias. These findings are generalizable to patients with MS who survive long enough and are regularly followed up in MS clinics.
Conclusion
Herein we show that excess MS-related mortality is mainly influenced by initial presentation by MS type (progressive MS), sensory and cerebellar concerns, and higher levels of disability; excess mortality may also be influenced by motor concerns, low BMI, and the presence of pressure ulcers and neurogenic bladder. The contributing main causes of death were MS disease itself, infection, respiratory disease, and cancer. This finding indicates the need for giving more attention to preventive strategies that delay mortality, such as yearly influenza immunization and aggressively treating MS-related complications and comorbidities, especially vascular risk factors, in these patients. It also highlights the urgent need for DMT in progressive types of MS, which are significant causes of MS mortality; at present, such DMT medications are lacking.
PracticePoints
This study found that increased MS-related mortality is influenced by poor initial motor presentation, progressive MS type, and a higher level of disability.
The main causes of death were MS disease itself, infection, respiratory disease, and cancer.
Thus, attention should be given to preventive strategies such as yearly influenza immunization and aggressively treating MS-related complications and comorbidities, especially vascular risk factors, to delay MS-related mortality.
Financial Disclosures
The authors have no conflicts of interest to disclose.
References
Noonan CW, Kathman SJ, White MC. Prevalence estimates for MS in the United States and evidence of an increasing trend for women. Neurology. 2002; 58:136–138.
Redelings MD, McCoy L, Sorvillo F. Multiple sclerosis mortality and patterns of comorbidity in the United States from 1990 to 2001. Neuroepidemiology. 2006; 26:102–107.
McLeod JG, Barnett MH, Macaskill P, Williams DB. Long-term prognosis of multiple sclerosis in Australia. J Neurol Sci. 2007; 256:35–38.
Goldacre MJ, Duncan M, Griffith M, Turner MR. Trends in death certification for multiple sclerosis, motor neuron disease, Parkinson's disease and epilepsy in English populations 1979–2006. J Neurol. 2010; 257:706–715.
Smestad C, Sandvik L, Celius EG. Excess mortality and cause of death in a cohort of Norwegian multiple sclerosis patients. Mult Scler. 2009; 15:1263–1270.
Ragonese P, Aridon P, Mazzola MA, et al. Multiple sclerosis survival: a population-based study in Sicily. Eur J Neurol. 2010; 17:391–397.
Koch-Henriksen N, Brønnum-Hansen H, Stenager E. Underlying cause of death in Danish patients with multiple sclerosis: results from the Danish Multiple Sclerosis Registry. J Neurol Neurosurg Psychiatry. 1998; 65:56–59.
Alves-Leon SV, Malfetano FR, Pimentel ML, et al. Multiple sclerosis outcome and morbi-mortality of a Brazilian cohort patients. Arq Neuropsiquiatr. 2008; 66:671–677.
Ford HL, Gerry E, Johnson M, Williams R. A prospective study of the incidence, prevalence and mortality of multiple sclerosis in Leeds. J Neurol. 2002; 249:260–265.
Hader WJ. Disability and survival of multiple sclerosis in Saskatoon, Saskatchewan. Can J Neurol Sci. 2010; 37:28–35.
Bergamaschi R, Montomoli C, Candeloro E, Fratti C, Citterio A, Cosi V. Disability and mortality in a cohort of multiple sclerosis patients: a reappraisal. Neuroepidemiology. 2005; 25:15–18.
McDonald WI, Compston A, Edan G, et al. Recommended diagnostic criteria for multiple sclerosis: guidelines from the International Panel on the diagnosis of multiple sclerosis. Ann Neurol. 2001; 50:121–127.
Lublin FD, Reingold SC. Defining the clinical course of multiple sclerosis: results of an international survey. National Multiple Sclerosis Society (USA) Advisory Committee on Clinical Trials of New Agents in Multiple Sclerosis. Neurology. 1996; 46:907–911.
Kurtzke JF. Rating neurologic impairment in multiple sclerosis: an expanded disability status scale (EDSS). Neurology. 1983; 33:1444–1452.
Granger CV. The emerging science of functional assessment: our tool for outcomes analysis. Arch Phys Med Rehabil. 1998; 79:235–240.
Yu W, Ravelo A, Wagner TH, et al. Prevalence and costs of chronic conditions in the VA health care system. Med Care Res Rev. 2003;60(suppl 3):146S–167S.
Murray CJ, Lopez AD. Evidence-based health policy: lessons from the Global Burden of Disease Study. Science. 1996; 274:740–743.
Kaplan EL, Meier P. Nonparametric estimation from incomplete observations. J Am Statist Assn. 1958; 53:457–481.
Munger KL, Chitnis T, Ascherio A. Body size and risk of MS in two cohorts of US women. Neurology. 2009; 73:1543–1550.
Leray E, Morrissey S, Yaouanq J, et al. Long-term survival of patients with multiple sclerosis in West France. Mult Scler. 2007; 13:865–874.
Grytten Torkildsen N, Lie SA, Aarseth JH, Nyland H, Myhr KM. Survival and cause of death in multiple sclerosis: results from a 50-year follow-up in Western Norway. Mult Scler. 2008; 14:1191–1198.
Kingwell E, van der Kop M, Zhao Y, et al. Relative mortality and survival in multiple sclerosis: findings from British Columbia, Canada. J Neurol Neurosurg Psychiatry. 2012; 83:61–66.
Wallin MT, Page WF, Kurtzke JF. Epidemiology of multiple sclerosis in US veterans, part VIII: long-term survival after onset of multiple sclerosis. Brain. 2000;123(pt 8):1677–1687.
Scalfari A, Neuhaus A, Daumer M, Ebers GC, Muraro PA. Age and disability accumulation in multiple sclerosis. Neurology. 2011; 77:1246–1252.
Jick SS, Li L, Falcone GJ, Vassilev ZP, Wallander MA. Epidemiology of multiple sclerosis: results from a large observational study in the UK. J Neurol. 2015; 262:2033–2041.
Hirst C, Swingler R, Compston DA, Ben-Shlomo Y, Robertson NP. Survival and cause of death in multiple sclerosis: a prospective population-based study. J Neurol Neurosurg Psychiatry. 2008; 79:1016–1021.
Sadovnick AD, Eisen K, Ebers GC, Paty DW. Cause of death in patients attending multiple sclerosis clinics. Neurology. 1991; 41:1193–1196.
Nelson RE, Xie Y, DuVall SL, et al. Multiple sclerosis and risk of infection-related hospitalization and death in US Veterans. Int J MS Care. 2015; 17:221–230.